Curvefit Interface
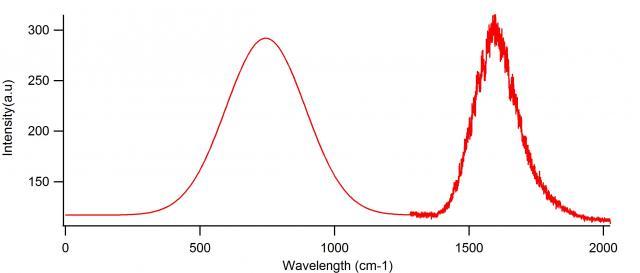
I want to make a interface to make simple Gaussian fit on a open Graph, plot the fit results(graph) on top of the original graph and save the results in a notebook. Basically I tried to reuse the codes from hordstein`s (Writing Results of a Curve Fit to a Notebook) code and out it ...some I have a problem ...what I want is to plot the fit curve over the main curve ...but the fit curve get shifted along x axis ( see attac.. picture)...I treid to appendtoGraph...does not worked ..somehow it does not get the x axis of the graph.
Function SendGaussianFitResultsToNB(nb, comment, dataWave, W_coef, W_sigma)
    String nb               // Name of notebook, e.g., "Notebook0"
    String comment          // Comment to be added to the notebook
    Wave dataWave           // The wave that was fit
    Wave W_coef         // Output from the CurveFit operation
    Wave W_sigma            // Output from the CurveFit operation

    // If notebook does not exist, create it
    if (WinType(nb) == 0)
        NewNotebook /N=$nb /F=1
    endif

    String text = ""
    String temp

    text += "\r"                // Blank line to separate from previous run
    text += comment + "\r"

    // Handle y0 coefficient
    sprintf temp, "y0 = %g +/- %g\r", W_coef[0], W_sigma[0]
    text += temp

    // Handle amplitude coefficient
    sprintf temp, "A = %g +/- %g\r", W_coef[1], W_sigma[1]
    text += temp

    // Handle x0 coefficient
    sprintf temp, "x0 = %g +/- %g\r", W_coef[2], W_sigma[2]
    text += temp

    // Handle width coefficient
    sprintf temp, "width = %g +/- %g\r", W_coef[3], W_sigma[3]
    text += temp

    // Insert text in notebook
    Notebook $nb, text = text
End

Function FitGaussianGraph()

String list = TraceNameList("", ";", 1)
String traceName
Variable index = 0

do
traceName = StringFromList(index, list)
if (strlen(traceName) == 0)
break // No more traces.
endif
WAVE yw = TraceNameToWaveRef("", traceName)
//print tracename
wave xw = XWaveRefFromTrace("", traceName)

// Do the curve fit
    CurveFit gauss yw /D
    Wave W_coef, W_sigma                        // These are outputs from the fit

    // Change the color of the destination wave
    ModifyGraph rgb(fit_gaussian) = (0, 0, 65535)

// AppendtoGraph fit_gaussian vs  xw

    // Add results to the notebook (after creating it if necessary)
    String comment = "Fit performed on " + date() + " at " + time()
    SendGaussianFitResultsToNB("FitResultsNotebook", comment, yw, W_coef, W_sigma)

index += 1
while(1)
end


CurveFit gauss yw /X=xw/DJohn Weeks
WaveMetrics, Inc.
support@wavemetrics.com
June 11, 2012 at 02:31 pm - Permalink
But I am curious to know
a) The rawdata is the output from a spectrometer (Intensity, wavelength) and I import that as two wave (wave0 and Wave0Int : respectively as wavelength -> x axis and Intensity-> y axis) after some arithmetic operation on raw data.
But when I apply the Gaussian fitting ...the fitted results comes as and not as wave. ( They are XY data I believe...) Is there is anyway to convert them as wave or its not possible physically ( they are not spaced equally ? or something elase).
June 11, 2012 at 04:47 pm - Permalink
I'm not sure I understand the question, but the destination wave created by the fit (fit_) is a waveform. To see this, try these commands:
June 11, 2012 at 05:48 pm - Permalink
Also why I can not change this type name like or names to wave1 ..wave2 etc...it does not allow me ( using rename wave) to change the extension .x or .d ...only fit_XData or fit_YData I can change...How can I change the whole name fit_xData.x to say wave1...
June 11, 2012 at 06:12 pm - Permalink
This has to do with table column names which are derived from wave names:
June 11, 2012 at 07:14 pm - Permalink
So it has to with index(.x) and data(.d) of 1D wave fit_YData
So one of the option to change the name will be : To split this fit_YData wave as two wave , wave 1 and wave2 where wave1=fit_YData.x and wave2=fit_YData.d and replace the table of fit_YData with a new table whose column are wave1 and wave2
I need it for some next loops as I have problems with name .x and .d ..
I will be grateful if you can tell me how can I do that....
June 11, 2012 at 07:42 pm - Permalink
I'm not sure why you want to do that. In general it is best to avoid XY pairs if a waveform will do, which is most of the time.
You can rename the fit destination wave using the Rename operation.
You can get the x value of a waveform by using simply x:
Rather than doing this which creates unnecessary waves and complicates subsequent programming, you should keep it as a waveform and access the X information using the x, leftx, deltax and rightx functions.
Execute this for more information:
June 11, 2012 at 09:49 pm - Permalink
more advice from you
June 12, 2012 at 08:30 pm - Permalink