TGSGUI optical simulation program
Takaki HATSUI writes:
Using Igor Pro as A Graphical Engine for Your Code/Instrument
I am a researcher in soft x-ray spectroscopy and am building a new spectrometer. In the course of the optical design of the spectrometer, I was forced to write a simulation program, TGSGUI, in order to optimize the spectrometer performance.
In the simulation, visualization of the data is very important, but not so simple to write. It frequently takes time to develop such code even if you use the latest graphical libraries. In my case, I chose Igor Pro as a graphical engine. Igor Pro has a capability to communicate with other program both on Windows and Machintosh. So, I just wrote an additional code that tells Igor Pro what and how to plot. In such a way, I could quickly implement state-of-art visualization libraries to my code.
In TGSGUI, DDE is used for communication with Igor Pro. Although DDE is obsolete technology, it still works. Wavemetrics also provides Active X automation, which is a more powerfull method to communicate with Igor Pro.
In the real experiment, Igor Pro takes also an important role in our laboratory. The above mentioned spectrometer acquires data through custom-made digital CCD camera. The camera is controlled by a program written in Visual C++ supplied by our co-workers. In this case, we also chose Igor Pro as visualization engine. The data is automatically sent to Igor Pro, which conducts detailed analysis in a few seconds. We do the simulation at the same time and compare the simulation with the experiment. This process is critical as optical path is stored in the vacuum chamber and we can not see the soft x-ray. In this way, we can precisely align all the mirror and grating of the spectrometer.
I would like to mention at the end about the supporting environment. Wavemetrics kindly gave me many suggestions in the course of the development. Thanks to Wavemetrics for their plenty of kindness.
Takaki HATSUI
Research Associate
Department of Vacuum UV photoscience
Institute for Molecular Science
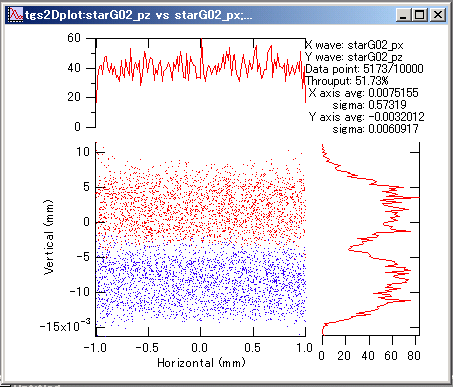
Here is a sample graph:
Image on the detector of a transmission-grating spectrometer (TGS)


Forum

Support

Gallery
Igor Pro 9
Learn More
Igor XOP Toolkit
Learn More
Igor NIDAQ Tools MX
Learn More