Voxelgrams are used to designate iso-levels in dense data sets where for computation efficiency it is undesirable to compute the full isosurface. Voxelgrams draw a point or a cube at a location corresponding to scalar values that match the selected level. If the data are particularly dense then points produce the quickest results.
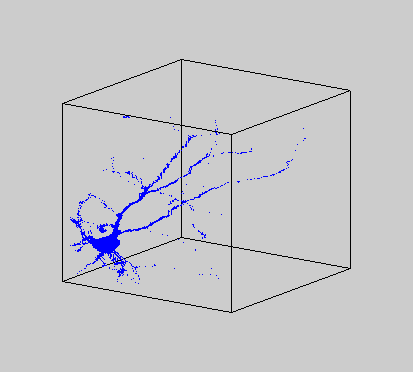
The example below is a voxelgram generated from a two-photon image stack of a GFP-labeled cortical pyramidal neuron. Data provided by J. Eilers, Leipzig, Germany. The single-level point voxelgram image was generated after 3D image processing of the original data.

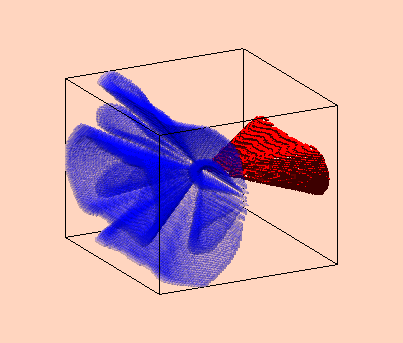
Voxelgrams are also useful for highlighting ranges of function values. For example, the following voxelgram shows three ranges of scalar values represented as colored cubes. The dark red cubes designate a value very close to that of the red cubes.


Forum

Support

Gallery
Igor Pro 10
Learn More
Igor XOP Toolkit
Learn More
Igor NIDAQ Tools MX
Learn More