The Hodges-Ajne test provides a non-parametric measure for the angular uniformity of the data.
Uniform angular distribution
We create the distribution using the following command:
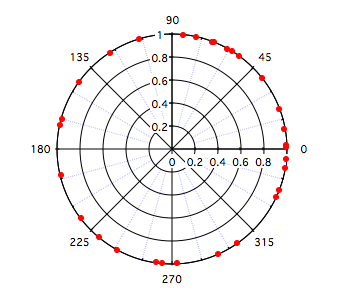
Make/O/N=30 data1=mod(2*pi*(1+enoise(1))/2,2*pi)
The data are displayed in the polar graph below.

To run the test execute the command:
StatsHodgesAjneTest/T=1/Q data1
The results are shown in the Hodges-Anje Stats table:
| Input_Points | 30 |
| m | 10 |
| Critical | 6 |
| alpha | 0.05 |
| P | 0.559632 |
This means that the least number of data that can be found on one side of any diameter of this circle is 10. Since the critical value is 6, H0 of uniformity is accepted with a P-value 0f 0.559632. Note that in this case m must exceed the critical value to accept H0.
Working with a non-uniform distribution
We create the non-uniform distribution by executing the command:
Make/O/N=30 data2=mod(pi*(1+enoise(1))/3,2*pi)
StatsHodgesAjneTest/T=1/Q data2
| Input_Points | 30 |
| m | 0 |
| Critical | 6 |
| alpha | 0.05 |
| P | 5.5e-08 |
In this case the operation found a diameter where there were no data on one side. This is a clear violation of uniformity and H0 must be rejected.
Testing uniformity against a specific direction alternative
Using data2 from above we first test against an alternative with mean direction pi/8. To execute the test enter the command below:
StatsHodgesAjneTest/T=1/Q/SA=(pi/8) data2
The results are shown in the Hodges-Anje Stats table:
| Input_Points | 30 |
| 90_degree_Points | 28 |
| C_statistic | 2 |
| Critical | 9 |
| P_value | 8.6e-07 |
In this case the test for uniformity indicates that we must reject H0 in favor of the alternative. If we execute:
StatsHodgesAjneTest/T=1/Q/SA=(pi/3) data2
| Input_Points | 30 |
| 90_degree_Points | 30 |
| C_statistic | 0 |
| Critical | 9 |
| P_value | 0 |
We observe that there is an even stronger rejection of H0 in favor of the alternative concentration about pi/3.

Forum

Support

Gallery
Igor Pro 10
Learn More
Igor XOP Toolkit
Learn More
Igor NIDAQ Tools MX
Learn More