You can perform particle analysis on a binary image using the ImageAnalyzeParticles operation. A particle in the binary image may consist of one or more pixels whose level is zero.
You can constrain the analysis to a defined region using an ROI and you can define a particle to consist of a minimum number of pixels. After executing the operation you will have the total number of particles as well as the following data for each particle:
Area: The total number of pixels in the particle.
Perimeter: The count of pixels in the particle's perimeter.
Extrema: the minimum and maximum pixel locations in both the x and y directions.
Seed Pixel: The x, y location of a pixel inside the particle (for use with ImageSeedFill).
Raw Moments: Include the sum of xi for all pixels in the particle.
The sum of yi for all pixels in the particle.
The sum of xi2 for all pixels in the particle.
the sum of yi2 for all pixels in the particle.
The sum of xi*yi for all pixels in the particle.
Fitting ellipses: The center, major and minor axes of an ellipse which fits the particle best and has the same area.
You can also use the operation to create masks for any particle or for particle boundaries.
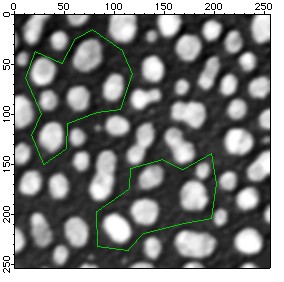
In the following example, the conventional blobs image is used together with a user defined ROI. In this case the ROI was selected as two disjoint simple polygons.

Blobs image with an overlay (green) showing the user defined ROI.
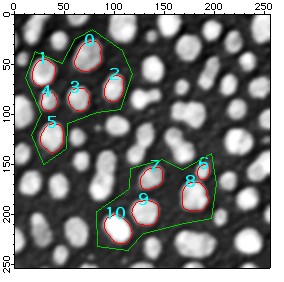
After using ImageThreshold and ImageAnalyzeParticles operations we find 11 qualifying particles shown below

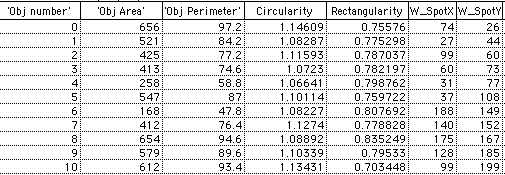
The following table contains some of the numerical results of particle analysis.

Using Particle Analysis for Classification
You can use the numerical results of particle analysis as part of an automatic particle classifier. In the following example we have an image of screws washers and nuts and we use particle analysis results to differentiate between elonaged objects (screws) and round objects (washers and nuts).
An overlay of particle boundaries that were obtained in the analysis on top of the original image together with particle indexing.
Eccentricity plot showing that particles 0, 3, 4, 8, and 11 have much lower eccentricity (i.e., they are more circular). Other particles are clearly differentiated based on this classification.

Forum

Support

Gallery
Igor Pro 9
Learn More
Igor XOP Toolkit
Learn More
Igor NIDAQ Tools MX
Learn More