Object plots are used for modelling 3D geometries using combinations of object primitives such as line, triangle, quadrangle, cube, sphere, cylinder, disk, etc.
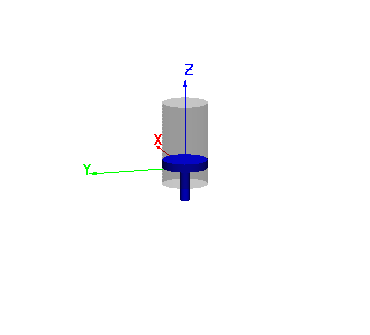
In this example we show a simple illustration of a piston inside a cylinder. It is fairly easy to modify the plot so that the piston follows an harmonic motion in the Z-direction.
Objects can also be combined with data. For example, we can combine the shore-line data with a sphere (close enough representation of the globe) and line objects to produce the following combination.
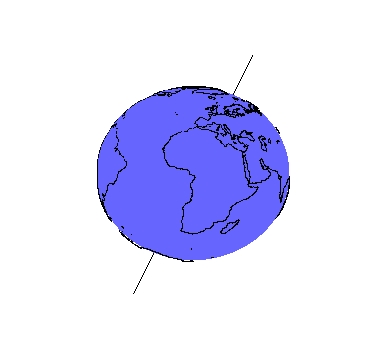
A much better representation of the earth can be obtained using textures and a sphere object.


Forum

Support

Gallery
Igor Pro 10
Learn More
Igor XOP Toolkit
Learn More
Igor NIDAQ Tools MX
Learn More