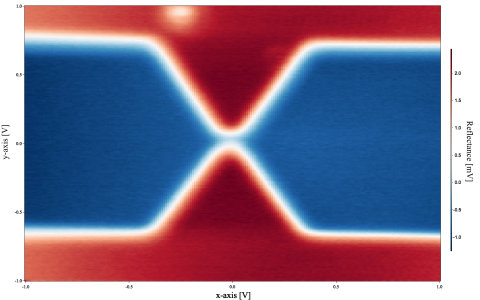
Baseline fit and subtract of an image
Hello,
Is there any way to fit and subtract the baseline of an image?
I wrote this function to load the .hdf5 file and plot this image.
Function LoadReflectanceImageFile([variable x_min, variable x_max, variable y_min, variable y_max, variable x_length, variable y_length, string file_name])
    x_min = paramIsDefault(x_min) ? -1 : x_min //this means x_min = -1
    x_max = paramIsDefault(x_max) ? 1 : x_max //this means x_max = 1
    y_min = paramIsDefault(y_min) ? -1 : y_min //this means y_min = -1
    y_max = paramIsDefault(y_max) ? 1 : y_max //this means y_max = 1
    x_length = paramIsDefault(x_length) ? 201 : x_length //this means x_length = 201
    y_length= paramIsDefault(y_length) ? 201 : y_length //this means y_length = 201

    String datasetName="DAC-ADC - BUFFER_RAMP"
    Variable groupID
    Variable fileID
    variable i,j

    HDF5OpenFile /R /Z fileID as "" // Displays a dialog

    if (V_Flag != 0)
        return -1       // User cancelled
    endif

    if (V_flag == 0)    // User selected a file?
        make/o/n=(x_length,1,0,y_length) tempReflectanceImageData
        HDF5OpenGroup /Z fileID, "./Traces", groupID
        HDF5LoadData /N=tempReflectanceImageData /O groupID, datasetName
        HDF5CloseFile fileID
    endif

    if(!ParamIsDefault(file_name))
        make/o/n=(x_length,y_length) $file_name
        Wave newWave = $file_name
        for(i = 0; i < x_length; i++)
            for(j = 0; j< y_length; j++)
                newWave[i][j] = tempReflectanceImageData[i][0][j]
            endfor
        endfor
        showImages(newWave, xLabel="x-axis", yLabel="y-axis", colorLabel="Reflectance")
        SetScale/I x x_min,x_max,"", newWave
        SetScale/I y y_min,y_max,"", newWave
    else
        make/o/n=(x_length,y_length) ReflectanceImageData
        for(i = 0; i < x_length; i++)
            for(j = 0; j< y_length; j++)
                ReflectanceImageData[i][j] = tempReflectanceImageData[i][0][j]
            endfor
        endfor
        showImages(ReflectanceImageData, xLabel="x-axis", yLabel="y-axis", colorLabel="Reflectance")
        SetScale/I x x_min,x_max,"", ReflectanceImageData
        SetScale/I y y_min,y_max,"", ReflectanceImageData
    endif

    killwaves tempReflectanceImageData
    Label bottom "\\f01\\Z30\\F'Times New Roman' x-axis [V]"
    Label left "\\f01\\Z30\\F'Times New Roman' y-axis [V]"
    ColorScale/C/N=text0 "\\f01\\Z30\\F'Times New Roman' Reflectance [mV]"

    return 0            // Success
End
I have also attached the .pxp & .hdf5 and file.
Any help and suggestions are appreciated.
Thanks,
- Doha


I think you need to define what you mean by 'baseline'.
October 21, 2019 at 07:04 am - Permalink
Hello Doha,
I suggest you start by executing the following command:
This will take you to a relevant discussion in the ImageProcessing Tutorial that illustrates an approach for solving this problem.
A.G.
October 21, 2019 at 10:37 am - Permalink
In reply to I think you need to define… by tony
When I plot one column of this matrix, I got the attached plot. I tried and @Tony's Baseline code works perfectly.
so, I was thinking of doing that for all columns and automatically. I think a more appropriate word will be 'background correction'. Sorry about that.
October 22, 2019 at 12:03 pm - Permalink
So you mean the rather broad signal variance underlying your signal, which I would describe maybe as 'inconsistent illumination'. At first I thought that you could just take an average of the profile at the lower edge of your image data and subtract or otherwise normalize the whole image with it (see attached subtracted image 'subtracted profile - edge'). But it seems the 'baseline' differs in size in different parts of the image, i.e., the slope is smaller in the center than on the edges. This makes things quite difficult, I guess. Also, your image is slightly rotated, which would make it very difficult to find a reasonable baseline for the upper and lower edges of your structure.
It seems the baseline shape can be reasonably described by a Gaussian. I would try to fit a Gaussian (with width and position fixed, i.e., only height variable) to the data on the left and right outer rims of your image (where there is no structure) and try to construct a reasonable baseline based on the varying overall intensity. You need to decide what to do at the upper and lower edges. Maybe a smooth transition from the size at the rim and the center could do. If you do not care about the outer parts, just fixing the center might be enough. I have fitted the baseline of the very center of the image and subtracted it from the whole data (see graph ' subtracted profile - center')
Another approach could be to just save the image and use your favorite image modification software to fix the rotation and make the illumination uniform, e.g., with a gradient layer mask.
October 22, 2019 at 08:13 pm - Permalink
Maybe this is what you seek to do:
select some region of interest within the image to define as a background region, i.e. the blue areas
fit those values with a 2D function (a surface)
subtract that fit from every pixel value
Is that correct?
October 23, 2019 at 05:29 am - Permalink