Creating a Surface Plot
I'm new here, actually first time for me to join a forum, and I would need some help to solve it. :)
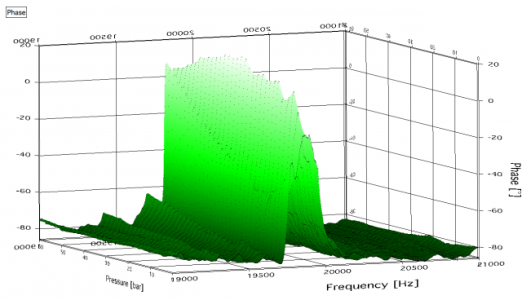
I have to make an analysis of some measurements, done by a Phd student. He measured the impedance and phase angle over a frequency band (of a piezo element). He did this in a pressured chamber from 0 to 60 bar (0,2,4,6 ...60bar). I created a surface plot from this data --> no problem
However he repeated this test with another piezo element and started again with 0,2,4,6 bar until 20 bar, than instead continuing with steps of 2 bar he took the decision to make steps of 5 bar (25,30,40,45 bar).
Now I got stuck because I need to make a surface plot from this inconsistent data but can't figure out how because of the change of pressure steps (0,2,4,6...20,25,30,40,45 bar pressure).
Usually I made a 2D matrix an changed the delta of the column to 2 (for the bar) and 1.5 for the rows (Hz for frequency), defined start for both, done. Easy as it gets! Now I can't do that for the pressure any more (first delta of 2 and than delta of 5).
I tried to create 2 2d matrices, one with 2 as delta (column) and one with 5 as delta (column). However, as soon as I combine those 2 it changes automatically to 2 for the combined matrix.
Somebody got an idea?
Greetings, Bernd
PS: enclosed there is one surface plot to get an idea


July 20, 2016 at 08:03 am - Permalink
#include <XYZtoMatrix>in your procedure file. This adds three macros to interpolate separate X, Y, and Z waves or an XYZ triplet wave into a two-dimensional matrix of Z values. Then you can display the entire surface in Gizmo as a standard matrix wave.July 20, 2016 at 08:05 am - Permalink
Alternatively you can use the data that is sampled on a coarse scale and interpolate it down to the same scale as your fine scale data set and then combine the two sets with a single sampling.
A.G.
WaveMetrics, Inc.
July 20, 2016 at 01:00 pm - Permalink
I managed it with the "Append Surface..." and it worked pretty straight forward. Actually I could have thought about that by myself *deeplyashamed*^^
I wish you all the best and greetings from Austria,
Bernd
July 20, 2016 at 10:45 pm - Permalink