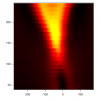
Adding an x-offset to 2d image plots
I'm trying to plot my data as 2d image plots as shown in the sample pdf file I've attached. We have a measurement related drift in x direction which increases in y-direction. I would like to center this graph around 0 to have a symmetric plot. Until now I have only found the setscale command which rescales the whole 2d matrix. I need to rescale each of the waves of the 2d matrix by adding an offset.
Is that possible in a 2d image plot or do i need to take a different approach?
Thanks a lot!


--Jim Prouty
Software Engineer, WaveMetrics, Inc.
October 2, 2015 at 09:53 pm - Permalink
Thanks for the quick response.
Although the MatrixtoXYZ allows me to create the needed waves the reconversion loses a lot of data. Although I use the right amount of rows/columns I get a triangular image instead of a rectangular one.
October 3, 2015 at 06:58 am - Permalink
October 3, 2015 at 07:04 am - Permalink