van der Waals Isotherm Plots
This package provides a way to show the pressure - molar volume isotherms for a range of gases that follow the van der Waals gas law. It was created as part of assignment for a course on thermodynamics, specifically dealing with mechanical equations of state for real gases.
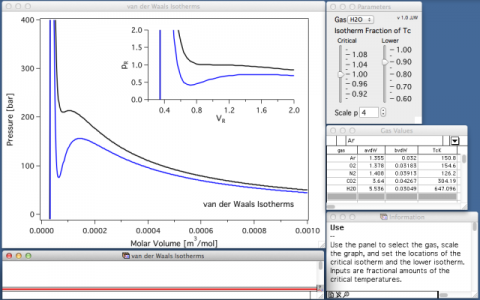
Two isotherms are shown on a main graph and an inset. The primary (black) curve is around the critical temperature and a second (blue) curve is typically lower than this. You can adjust the reduced temperature for either isotherm. The main plot is in bar versus molar volume. The inset plot is in reduced pressure versus reduced molar volume. You can add additional gases by editing in the table.
View All Releases
Two isotherms are shown on a main graph and an inset. The primary (black) curve is around the critical temperature and a second (blue) curve is typically lower than this. You can adjust the reduced temperature for either isotherm. The main plot is in bar versus molar volume. The inset plot is in reduced pressure versus reduced molar volume. You can add additional gases by editing in the table.
Project Details
| Project CVS: | http://svn.igorexchange.com/viewvc/packages/vdWIsothermPlots/ |
Current Project Release
van der Waals Isotherm Plots IGOR.6.30.x-1.0
| Release File: | van der Waals Isotherms.pxp (65.14 KB) |
| Version: | IGOR.6.30.x-1.0 |
| Version Date: | |
| Version Major: | 1 |
| Version Patch Level: | 0 |
| OS Compatibility: | Mac-Intel Windows |
| Release Notes: |
This is the first release of the package. Enjoy! -- JJW |

Forum

Support

Gallery
Igor Pro 10
Learn More
Igor XOP Toolkit
Learn More
Igor NIDAQ Tools MX
Learn More

