Multipeak Fit with original negative peaks?

garrison
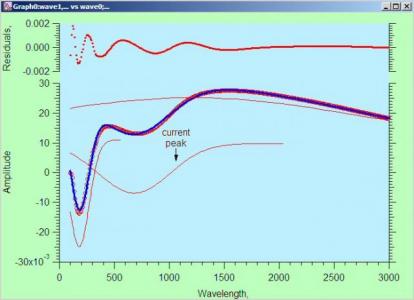
I am new to Igor Pro and but found it is powerful for signal process. I would like to decompose some characteristic peaks from an experimental measurement. I think the MultiPeak Fit function of Igor Pro should do the job. After several days of trying, I still can't get it works correctly. For example, although it could fit the total curve nicely, but the decomposition, ie. the individual peaks, is not correct.
The experimental data is attached. Could any expert please advice how to utilize MultiPeak Fit and solve the current fit that I can use it an an example to solve many of other measurements.
Thank you very much for your kind help.
Regards,


If you have negative peaks you can do one of two things:
1) duplicate your Y data and negate it:
Duplicate YDataWave, NegativeYData
NegativeYData = -YDataWave
Naturally, you need to change the names in the commands to match your actual wave names.
2) Use Multi-peak Fit 2, which can handle negative peaks directly. It is part of the version 6.1 beta, which you can download here:
http://www.wavemetrics.net/Updaters/AboutPublicBetaVersions.html
John Weeks
WaveMetrics, Inc.
support@wavemetrics.com
November 12, 2008 at 10:10 am - Permalink
John Weeks
WaveMetrics, Inc.
support@wavemetrics.com
November 12, 2008 at 10:13 am - Permalink
Thanks for the recommendations. I have a try on the first method, making it 3 positive peaks. This time it works quite good. But the point is, when the curve is decomposed from positive peaks, the absolute amplitude of the peaks would be less than the original peak. While for a combination of negative and positive peaks, the absolute amplitude of the negative peak would be higher to compensate the adding up of the adjacent positive peak. So the results of the first method would need to be further adjusted. I hope I have made it clear.:)
For your second reply, the fitting shown in the attached figure in my original post is quite good. But that's not what I want. I hope to get a fit that the decomposed peaks would be matching those 3 major characteristic peaks, namely, the first negative peak and the next positve peak followed by a large peak with tailing. ie. I want the decomposed peaks for further analysis.
I have a try with Excel functions showing what I expected to get and the result is attached for your reference. The Igor results is also saved in the file. I am using Igor Pro 6.04. Can this version do what I hope to get?
Thank you very much for your great help.
Regards
November 14, 2008 at 12:23 am - Permalink
Also, there is something wrong with the link to download your Igor experiment file. Could you e-mail it to support@wavemetrics.com?
I have attached an Igor experiment file containing a graph showing a fit I did with Multipeak Fit 2, using the ExpModGauss function. It's not perfect, but it's pretty good.
Can you tell me what information you want from the fit? What is the significance of the negative peak?
John Weeks
WaveMetrics, Inc.
support@wavemetrics.com
November 13, 2008 at 10:12 am - Permalink