Diagnostic Tools in motofit
1. plot of chi2 error vs. # of trials
Unsure of how to do this, but I think I need to concatenate the chi2 value onto a wave during the evaluation loop and then display this wave. Is there an easier way to do this? Chi2 is displayed in the progress window, so that value is in memory somewhere and should be grabable during execution. My first attempt to do this unfortunately failed.
2. Plot of Coefficient values vs. # of trials
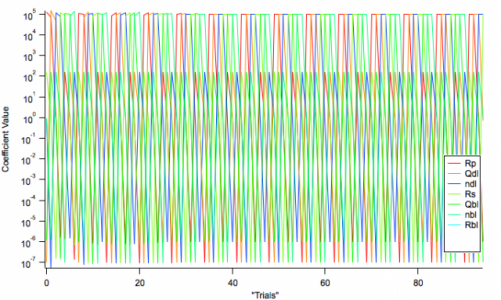
This one I have been able to do somewhat, utilizing /DUMP, which creates the matrix M_gencurvefitpopdump[n][*] where n is the coefficient number. (see attached image) However, there seems to be some problem here, as should I "hold" any variable during the fit, the output matrix is offset in such a way that I get something resembling a plaid shirt on acid (see second attached image). The values are still there, they are just not entered into the matrix in an orderly way. As a work-around, I have chosen to set the range of "Held" parameters to zero, for example varying a parameter between 200 and 200 results in a value of 200 being selected for every trial. I would prefer not to do this, however, as it is slower and clunkier in terms of UI.
The gencurvefit help file indicates the following about /DUMP:
/DUMP At the end of every iteration Gencurvefit will dump the genetic population of the parameters that vary, into a wave called M_gencurvefitpopdump. The wave will be 3D, having dimensions [V_nterms][V_nterms*popsize][]. The number of layers represent the output after each iteration. The first layer is that of the initial guess population and the last layer is that of the population when the fit terminates
However, the matrix is actually 2D and as far as I can tell contains the best (or average?) values of the population after a certain number of generations... which is why my graph was so easy to do in the first place. Did I miss something here? Also, I am able to do thousands of iterations, yet the number of points is much smaller, around 100 or so.
Thanks in advance!


January 24, 2012 at 12:46 pm - Permalink
However, I think there may be a bug in the /DUMP flag, not a deal breaker in terms of fitting correctness but probably making that matrix wave incorrect and 'plaidlike'. I wil put an updated version on the web in a couple of hours.
2) Plotting Chi2 vs # of trials is not currently possible from one operation of Gencurvefit. What you will have to do is call Gencurvefit in a loop. You should use the /SEED and /K flags to set the seed and number of iterations:
January 24, 2012 at 01:36 pm - Permalink
2. Hmm.... It seemed easier to me when I first looked at this.
as always, thanks andy
January 24, 2012 at 03:44 pm - Permalink
No worries. The plaid effect no longer happens. There was a bug in the code for the /DUMP flag. It's now fixed and available for download.
January 24, 2012 at 03:58 pm - Permalink
January 24, 2012 at 04:12 pm - Permalink
I have been able to implement everything I wanted thanks to your code example, but I have lost some of the convenience of the global fit panel, most notably the ability to link coefficients and fit multiple functions simultaneously (I assume this is accomplished using a structure fit, but I haven't been successful in getting that going). Because I am fitting complex data (a+b*i), I really need this functionality.
I was also unable to find an option or flag listed in the help file for specifying log spaced data (which is needed to produce proper graphs for the fit function vs. empirical data). Is there a flag for this? Global fit has a check-box, but it is possible that global fit is scaling the wave before feeding it to gencurvefit for all I know.
February 9, 2012 at 12:12 pm - Permalink
Perhaps I've got the wrong end of the stick, but the whole point of Globalfit is that you can link and fit multiple functions simultaneously. If it's not doing that, then it's important to know.
There is no way to specify log spaced fit data in the output of Gencurvefit, you would have to do that manually.
The version I wrote is a modified copy of the WM code, but I don't update it as frequently as they do.
February 9, 2012 at 01:02 pm - Permalink
February 9, 2012 at 01:35 pm - Permalink
February 14, 2012 at 09:05 pm - Permalink
It's not clear what you mean. What operations?
February 15, 2012 at 12:51 am - Permalink
February 15, 2012 at 07:16 am - Permalink
February 15, 2012 at 01:20 pm - Permalink
February 15, 2012 at 02:25 pm - Permalink
Whilst it would always be possible in coding terms, the current design was intentional. I use the /DUMP flag, with a monte carlo tempering scheme, to investigate whether the code can be used to investigate the posterior probability distribution of the parameter vectors.
February 15, 2012 at 03:19 pm - Permalink
I am trying to make some changes to the xop, but cannot compile it successfully. The source directory seems to be missing an included file, gencurvefit.h. Am I missing something here? Also, I am using version 6 of the XOP toolkit; I don't know if that makes any difference.
February 20, 2012 at 08:32 am - Permalink
February 29, 2012 at 08:32 am - Permalink