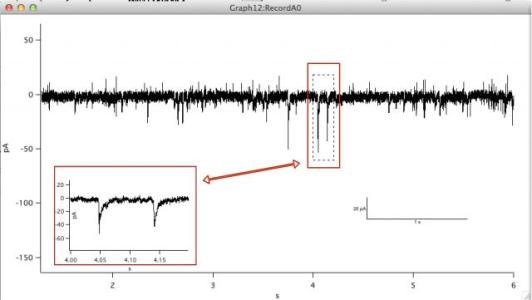
about the embed graph and the rectangle wrapped range

pangeng
here my question is how to make a precise plotting to make sure the embed graph has exactly the same y and x rang as the are that the rectangle plots.
hopping I stated my question clearly
my pic is attached.


how to plot a dotted frame surround the embed wave? I can plot a frame of solid line, shadowed line, double line by right click the embed graph and choosing frame.... but I did not find dotted option.
July 12, 2014 at 05:51 am - Permalink
SetDrawEnv xcoord= bottom,ycoord= leftwhich you can use in code if you are programming a user function to create your graph.The Frame options for an embedded graph do not include dotted lines. You will need to use the drawing tools to draw a suitable rectangle around your small graph.
John Weeks
WaveMetrics, Inc.
support@wavemetrics.com
July 14, 2014 at 09:24 am - Permalink