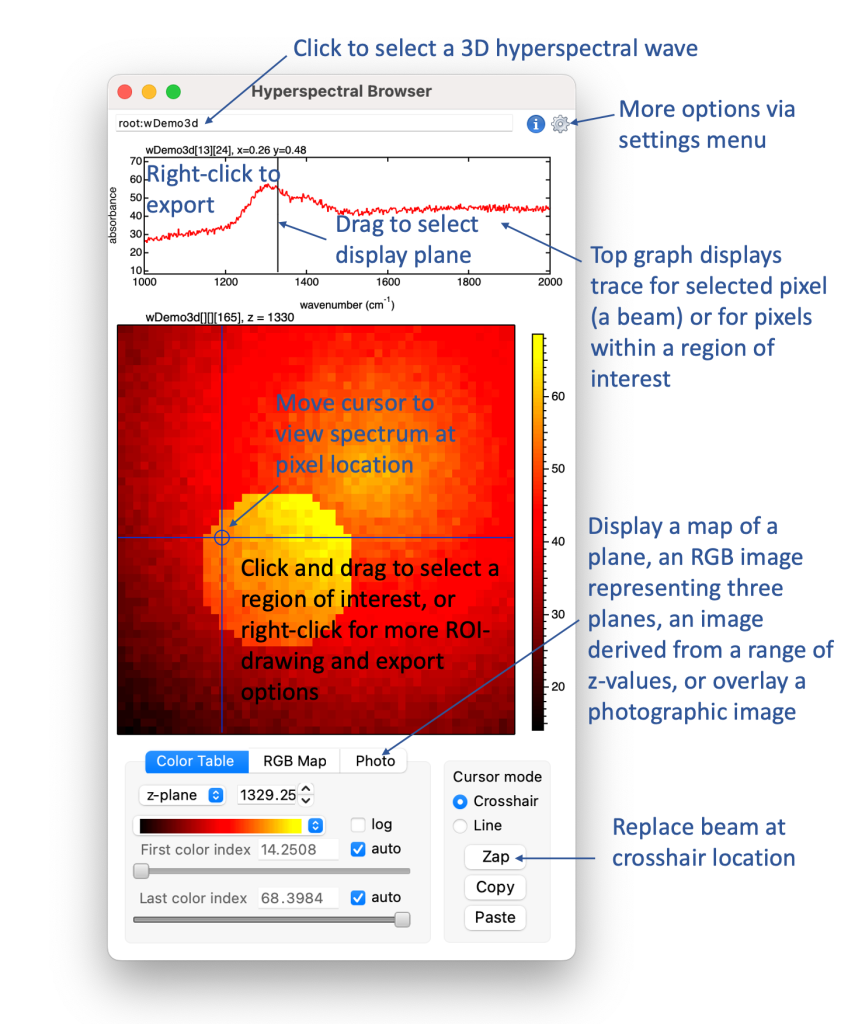
Hyperspectral Browser

A browser for exploring hyperspectral datasets.
The data must be saved as a 3D wave, with x and y representing spatial coordinates and with spectroscopic or time-series data stored in the z dimension. If the data in the z-dimension are not waveform, the z values (which you will likely think of as the horizontal axis of a spectrum) should be stored in a one dimensional "z-wave". To generate a dataset for testing, execute hyperspec#demo() from the commandline.
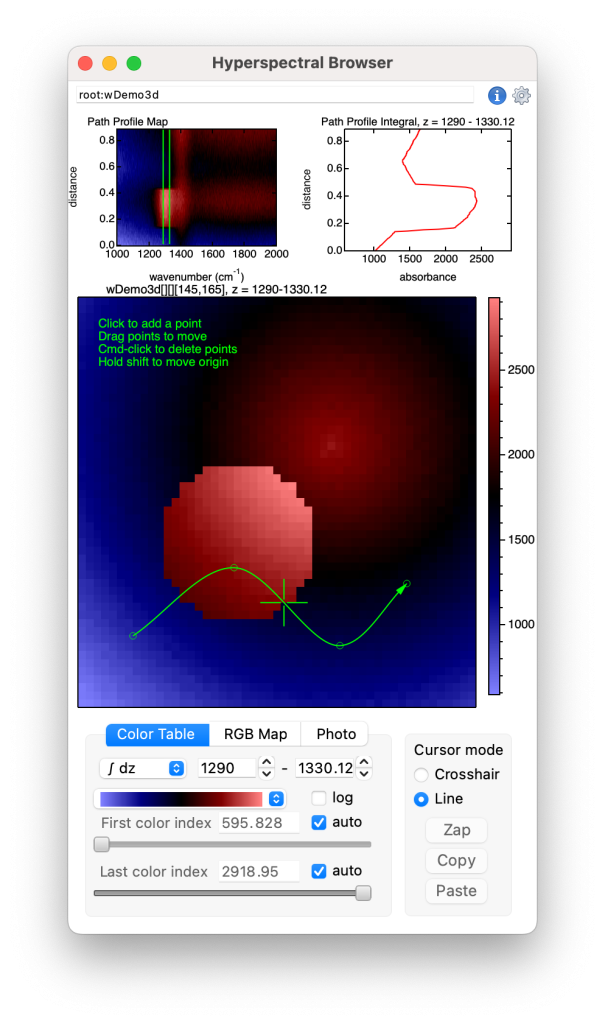
The browser provides a user interface to efficiently view spectra (i.e., data in the z-dimension, or beams of the data matrix) at different pixel locations or to average spectra over a region of interest. Path profiles can be generated interactively for lines, segmented lines, and splines. Regions of interest can be exported, as can path profiles and 1D waves representing the z-dimension of selected image pixels. RGB maps can be constructed to map data from up to three selected planes of the datacube.
Use cmd-R/ctrl-R to resize the panel according to the aspect ratio of the map display
The analysis tab
The analysis tab provides four options for dimensional reduction of the datacube:
- Similarity index: Each pixel of the map is compared with the currently displayed pixel trace. A 'similarity index' is calculated in spectral angle space.
- Non-negative matrix factorization: Uses a multiplicative algorithm to estimate linear combinations of non-negative components that fit the layers of each pixel. For now this uses only the basic NMF algorithm without further constraints. Seeding options and number of iterations are adjustable via settings menu.
- Independent components analysis: Uses AG's SimpleICA function, which is based on the FastICA algorithm.
- K-means clustering: Uses the built-in Kmeans operation to analyse the clustering of data. Maps the clusters and displays the average of the data layers for each cluster. Note that the Kmeans algorithm may not succeed in determining the number of clusters you have requested.
Both non-negative matrix factorization and independent components analysis calculations can be lengthy, especially if you are working with a large dataset. Maybe make some tests with a reduced size dataset (right-click and save data subset), and proceed with caution!
Export options
- Pixel traces are exported as 1D waves
- Profiles are exported as 2D waves with columns for x and y coordinates, distance from start, and data corresponding to the current map display options
- Maps are exported as 2D data waves or 3D RGB waves
- Paths are exported as 2D waves containing x and y coordinates
- Regions of interest are exported either as 2D mask waves or as layers appended to a 3D mask wave. Lines, paths, drawing objects, manually selected pixels, and regions of interest bound by splines or polygons can all be used to create a mask.
- A subset of the datacube can be exported as a new datacube: right-click and select 'Save Data Subrange...'
Note that the color scale for line profile maps is autoscaled to the visible data range, and does not correspond to the values shown on the scale bar for the x-y map view. To resize the graph subwindows, place the mouse cursor between the plots; when the cursor switches to a double-headed arrow, click-and-drag to resize.
Related projects:
For fitting baselines to large collections of spectra, the fast fitting project provides a user interface for setting up multithreaded baseline fitting. Fast fitting can take a 3D datawave as the input for baseline fitting.
The OPUS file loader project can load hyperspectra collected using a Bruker focal plane array infrared detector.
The WiRE file loader project can load Raman map hyperspectra from wdf files created by Renishaw Raman spectrometers.
If you have installed scroll-to-zoom you can easily zoom in and out to inspect subranges of data.
Project Details
Current Project Release
Hyperspec IGOR.8.00.x-2.05
| Release File: | Hyperspec205.zip (69.02 KB) |
| Version: | IGOR.8.00.x-2.05 |
| Version Date: | |
| Version Major: | 2 |
| Version Patch Level: | 05 |
| OS Compatibility: | Windows Mac-Intel |
| Release Notes: |
Improves efficiency of calculation of beam average with round and square map cursors. |

Forum

Support

Gallery
Igor Pro 10
Learn More
Igor XOP Toolkit
Learn More
Igor NIDAQ Tools MX
Learn More
OK. This looks so cool that I want to run out and collect hyperspectra just to use it!!!
August 26, 2024 at 02:07 pm - Permalink
As you may have surmised, my three recent project releases were motivated by working with infrared hyperspectra generated by a focal plane array detector. I hope though that parts of this work will be more generally useful for Igor Pro users who work with spatially-resolved spectroscopic data. In version 1.01 I've added a demo function for testing the interface: execute hyperspec#demo() from the command line to generate some fake data.
August 28, 2024 at 03:00 am - Permalink
That looks very nice. I wish this project had been around when I was still working with hyperspectral data. The selection of regions is very elegant.
Perhaps it would also be good if the exported spectra could retain the original wave and range as a note. Otherwise there is a risk that this might be forgotten.
And is there a reason why the exported wave is Single Float 32 bit (and not Double Float 64 bit)? Information may be lost here.
September 9, 2024 at 05:24 am - Permalink
These issues are addressed in version 1.03. The precision of exported waves is now the same as that of the input data. When an output wave represents a pixel selected with the crosshair cursor or a rectangular region selected with the marquee, the range is saved in the wave's note. If you select a collection of pixels, draw a ROI using the UI, or use drawing layer shapes to select a region of interest, the output wave's note contains the name of the input wave + 'masked region'.
September 15, 2024 at 10:13 am - Permalink
If you downloaded this project prior to version 1.30 to test under Windows, I suggest trying version 1.30 or later, in which Windows compatibility is significantly improved.
November 1, 2024 at 03:20 am - Permalink
This continues to be one of the most eye-catching projects in Igor. Amazing!
January 17, 2025 at 08:48 am - Permalink
Hi Tony, very nice. I finally got around playing with this. While I probably have not (yet) any use for something like this, it is always interesting to see your approach. A few things I have noticed:
- The plots have issues when the data has units in all three dimensions. You might want to override units in the plots or otherwise incorporate them into the label (\u#2 or \U, respectively)
- Setting a marquee / ROI or other live actions can take very long if the data is 'big' (and I am talking only about data which is about 50 MB). This makes the tool unresponsive (in fact, it took up to several minutes in my case to generate the quick-roi). You might want to include a progress bar and abort button. I did not investigate what takes so long, but there might be room for optimization.
- Automatically set a minimum and maximum >0 if log colors are selected (to be fair, I also do not have this in my tools)?
- The package data is not deleted upon closing the tool? Is this intended to work with the data further? Otherwise it creates quite some overhead.
- Consider having the possibility for more than one browser open at the same time.
- Also, choosing another data set from the top bar resets the window position in a strange way. I guess you forgot to incorporate the proper scaling factors for the Windows version (I feel really sorry for Mac developers, but I have to deal with this crazy stuff as well ;-).
January 23, 2025 at 06:14 pm - Permalink
Hi Chozo,
Thanks for the useful feedback. I'll reply to each in turn:
That was indeed the easiest solution.
I've been working with datasets of around 30 MB, wave dimensions are 64 x 64 x ~2000, 32 bit. If the option to plot all of the pixel traces in the ROI is selected, updates are a bit slow for me - typically the code runs in less than 0.5s, but the graph update takes much longer. I'm not sure if there's anything I can do to improve efficiency here. If you choose not to plot every trace and just display the computed average the response should be better. What are the dimensions of the data that caused the long delays? I would like to investigate further.
Well, the auto min and max refer to the data limits, so I don't want to cause confusion by fudging the values. It would be great if selecting log would generate logarithmically spaced colours even when the limits are negative... the axis for color scale would need to be redesigned, though. The current behaviour of giving up when data are negative is OK for me. The user can easily adjust the limit to a non-negative value.
Fixed in next release
Yeah, I used MoveWindow with the wrong units, not the first time I have made that mistake. Hopefully fixed for the next release.
January 27, 2025 at 08:01 am - Permalink
Missed one!
My intention was to create a tool for efficiently exploring 3D datasets, but not to produce polished graphics or do a lot of data reduction, hence 'browser' in the name. I don't expect to relax that restriction in the near future.
January 27, 2025 at 08:19 am - Permalink
OK, now I see what is going on. I was testing this with one of my data sets which was 500 x 1000 x 30 points. Naturally, choosing even a tiny ROI will result in an enormous amount of traces. So the solution would be to limit the number of traces generated for the single-pixel option. Alternatively, you could make this feature scalable into "pseudo-pixels", i.e., groups of pixels whose size scales with the x and y dimensions. Anyway, you don't need to adapt to my type of data. But I pretty much have to kill the Igor task if I, even accidentally, drag with the mouse while using your tool. :-) The cheapest option would be to outright disable the single-pixel option if the data grows beyond, e.g., 5000 points in a single layer.
January 27, 2025 at 05:31 pm - Permalink
I think I found a reasonable solution for version 1.63. Let me know if this makes working with your large datasets less painful.
January 28, 2025 at 09:09 am - Permalink
Tony, thanks. This works great. Another small thing I found: In line mode the profile gets 'spikey' when the profile line has a certain direction across my data. I found that 'distanceCTline' can have stepped structures which change in size while dragging the line across the data causing this. I don't know if this is an artifact or just a result of the large layer I am working with. See the attachment.
January 28, 2025 at 07:23 pm - Permalink
When you use the cursors to define a line, the code computes a 'Bresenham' line between the end points. The profile should then have one point for every pixel along the line, and the distances and values for the profile should match the data, unless I have made some mistake. Using the dialog to save an ROI you can see which pixels are selected on the screen, or you can export the profile to a 2D wave and investigate the coordinates and values. The distances are calculated from pixel coordinates, so they do not increase with equal step size.
If you instead draw a linear path ("Draw ROI Linear"), the profile is calculated using ImageLineProfile, which will give different results because ImageLineProfile does some interpolation.
January 28, 2025 at 11:42 pm - Permalink
FYI, if you draw a curved path, the profile is calculated using ImageLineProfile based on xy coordinates that divide the path between each node into 50 sets of coordinates. I could expose that parameter and make it user-adjustable.
January 29, 2025 at 12:00 am - Permalink
OK, thank you for the explanation. I did not look too deeply into it. This might simply be an artifact from sweeping over many pixels (>800) in one direction vs. very few in the other. Draw ROI Linear works as expected.
January 29, 2025 at 04:57 am - Permalink
If you place the mouse cursor over a spike in the profile, the corresponding pixel in the map should be marked by a cross cursor. If the map is zoomed in you may be able to tell if the spikes are real noise in the data or if something is wrong with the profile.
January 30, 2025 at 12:08 am - Permalink
Version 2 includes new analysis options: non-negative matrix factorization, independent component analysis, and similarity index based on spectral angle. The analysis routines haven't been tested extensively. Your feedback is welcome.
January 30, 2025 at 09:57 am - Permalink
If you're testing the analysis options in version 2, note that non-negative matrix factorization tends to find a local minimum, so rerunning the analysis several times may provide more interesting results.
June 27, 2025 at 07:41 am - Permalink
v2.01 includes K-means clustering, as promised in the project description :)
July 3, 2025 at 06:55 am - Permalink