Rearranging a 2D point set to enclose the set with a line

sjr51
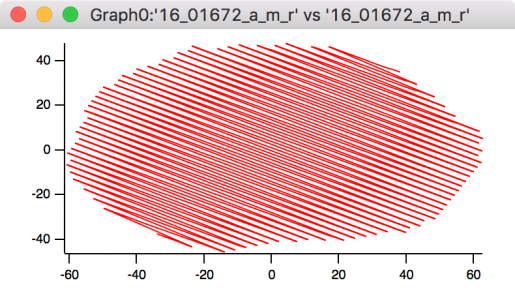
I am out of ideas and would appreciate any help. I have several sets of xy coords that form an approximately elliptical border (they are locations of a segmented region of an image). When I pulled them from the image they were arranged in a vertically ascending order. I'd like to rearrange them into a clockwise (or anti-clockwise) order so that the points form a border around the ellipse, like in the original image. Does anyone have an idea how to do this? I am attaching a picture of the plot as it stands. Essentially, I want to get rid of the zig-zag pattern.
Unfortunately, the order is not alternating (it looks like it from the image) so re-arranging it that way doesn't work. I've tried that!


Find the center (average x and y) and then calculate the angle from the center to the point and then sort the wave based on the angle.
Andy
June 27, 2017 at 08:02 am - Permalink
June 27, 2017 at 08:16 am - Permalink
I think you will also have to make your own ellipse 'x' and 'y' waves from the best-fit parameters, because the automatically created waves will follow the original sorting irregularity.
June 27, 2017 at 08:40 am - Permalink
Have you tried ConvexHull?
June 27, 2017 at 10:32 am - Permalink
It seems to me that ConvexHull might miss some end points that are close to the boundary, but slightly concave. Your help file example show at least one point illustrating such behavior. Stephen's data show other such potential problem points. Perhaps that is not an issue for him.
June 27, 2017 at 10:54 am - Permalink
best,
_sk
June 27, 2017 at 11:49 am - Permalink
If any point goes missing, one can use the convex hull path and solve for the shortest distance from the missing points to the hull path. The intersection with the hull-path would determine the order of the point in the sequence.
June 27, 2017 at 12:22 pm - Permalink
I have another idea. It may not be too elegant but gave me the possibility to test my understanding of conditional operators. It expects the non-ordered coordinates in two waves and gives the ordered coordinates in two new waves (x_oval and y_oval).
I have tested it only with one hand-drawn example. It could give problems when two or more points lie exactly on a horizontal or vertical line.
I hope it helps.
Greetings, Klaus
June 27, 2017 at 01:12 pm - Permalink
Yes. Here is one 2D wave, column 0 is x and column 1 is y.
June 27, 2017 at 11:22 pm - Permalink
Thank you. Yes, I have already been down this path. Actually these final point sets have been centred at the origin and rotated so that the semimajor axis along x at y=0 and semiminor is along y at x=0 so the fit is similar to the example in the manual. The problem is that I want the plots to look like the real data and not a fit to it.
June 27, 2017 at 11:26 pm - Permalink
Thank you for the suggestion. Yes, I'd like all points recovered and this put me off convex hull. I like this idea of recovering the other points and hadn't thought of that as a solution when fitting a convex hull for other problems - I had investigated "alpha shapes" as a solution and not got very far with that.
June 27, 2017 at 11:31 pm - Permalink
Hi Klaus,
Thank you for your answer and your code! I just tried one point set. It **nearly** worked for my data (see attached pic). From the original image I do have several consecutive horizontal and vertical values because they are pixel locations. However, because of the rotation I thought that these values would no longer be horizontal or vertical, so it should work. I'll investigate a bit more. Thank you.
June 27, 2017 at 11:40 pm - Permalink
Andy's idea worked and my code is below in case it is useful for anyone. Note that the points are centred at the origin and atan2 is used to get unique values for theta round one rotation.
I pass the 2-column wave to this as part of a larger stack.
June 28, 2017 at 12:35 am - Permalink