"Heat map" advice/opinion


I have a set of 2D coords and I'd like to plot the density of these points as a "heat map" (colour-coded map of probability at every location within a boundary). In the past, I have done one of two things:
1. 2D histogram - sample number of points in a grid and use that for representation, but this can look blocky. I have around 200 points so reducing bins can look weird with smaller bin sizes.
2. ImageInterpolate (voronoi) - for each point, calculate the number of neighbouring points within some arbitrary distance and use these values as z to make a surface with
ImageInterpolateI'm wondering if a better approach would be to make a 2D gauss at each location and sum these together (perhaps with smoothing) to make the representation.
I'm not sure how to go about doing this other approach. I've tried to investigate the new
StatsKDEIf anyone has:
- an opinion of what is the best way to make a heat map in these circumstances
- advice on how to do the third option.
I'd love to hear it. Otherwise, feel free to tell me to take this to stackexchange instead!
You might also want to check out the ImageFromXYZ operation.
FWIW: I think there is value in displaying the raw joint histogram results. The interpolation could lead you to misinterpret the results.
October 28, 2016 at 10:14 am - Permalink
October 28, 2016 at 10:33 pm - Permalink
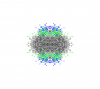
This is my code from years ago to do the third option you suggest. See here, for published example involving 2D maps of labeled neurons in brain sections
It assumes that x and y wave names are the same, except for ending with "x" and "y" respectively, and are generated from dataSetNameStr
Xmin, Xmax, Ymin, Ymax are boundaries of the output image
Pixelsize for output image is in whatever units your data are in, and Gaussian radius is the radius of the Gaussian kernel in pixels
I have attached a picture of some random data ovulated on its 2D gaussian blobbed equivalent
Jamie Boyd, Ph.D.
October 31, 2016 at 05:28 pm - Permalink
November 1, 2016 at 01:04 am - Permalink
so that the sum of the image will be equal to the number of points contributing to the image, for whatever size of kernel you use.
Jamie Boyd, Ph.D.
November 1, 2016 at 10:03 am - Permalink