How to create 3D surface plot from pixel data

CougMaster
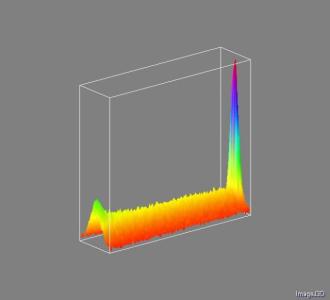
Relatively new Igor user here. I found this video on 3D plotting (https://www.youtube.com/watch?v=8j59XDL7rps&index=1&list=PLLe6A3jhXW3HG…) but unfortunately they didn't show the data used to make the plot. I have a csv file (attached to the post) of X-Y pixel intensity. My hope is to import this data into Igor pro and then use the Windows>New>3D Plots>Surface Plot feature to create a plot similar to the one attached.
My question: given my data file, how do I use Igor to format it in such a way to create the desired feature plot? I have found a few posts on 3D plotting but none seem to address this issue. If I have overlooked a previous post, please let me know. Any help you can give is appreciated.
Thanks!


Regardless of how you load your file, you need to end up with a 2D IGOR wave containing your data. The easiest way to display a 2D matrix as a surface is to right-click on the name of the wave in the Data Browser and choose Gizmo Plot.
Once you have your initial/default plot you may want to enhance it a bit. There are many ways to do that but if you want something that looks like the image you posted I'd first add a gray "clear color". To do that you right click in the Gizmo window and edit the background color. Again, from your example, the second change that you may want to do is to enforce aspect-ratio. You can do that by executing:
ModifyGizmo aspectRatio=1Although the image you posted does not use shading, you may want to add shading to enhance your graph. You can follow the video tutorials about shading or simply edit the surface object properties and check the Calc Normals checkbox. You then need to add a light object in the object list and drag it to the top of the display list. Typically you may also want to drag the axes object to the top of the display list so that it is not affected by lighting etc.
I hope this helps,
A.G.
WaveMetrics, Inc.
May 19, 2016 at 11:51 am - Permalink
After re-reading my post, I believe I may have been unclear in what exactly I need. I have an excel file that consists of 1842 rows and 632 columns (too large to attach but I can share it upon request). Each value in this spreadsheet represents the pixel value for the pixel that is associated with that position (the pixel value for the first pixel is the value shown in the first row, first column, etc.). When I import this into IgorPro, I get 632 waves that are 1842 rows long.
My question is how can I make a surface plot of this? From the examples I see and the explanation previously given, combining the 632 waves into 1 wave will give a 632 dimension wave. I just want a wave that has x,y,pixel value as the only dimensions.
Thank you again for your help. Please let me know what, if anything, I need to do to get the file into a format that will allow me to make a surface plot with Igor. I understand how to make the plot once the data is properly loaded but not how to get the data into a form that Igor can use.
May 19, 2016 at 03:34 pm - Permalink
should do the job after loading the waves via
XLLoadWaveHJ
May 20, 2016 at 06:50 am - Permalink
Here is a procedure that will load Excel data as a matrix (2D wave):
http://www.igorexchange.com/node/5648
You could also copy from Excel and paste into a table or save as a text file from Excel and load into Igor as general text, but I think the procedure referenced above will be easiest.
May 20, 2016 at 02:11 pm - Permalink