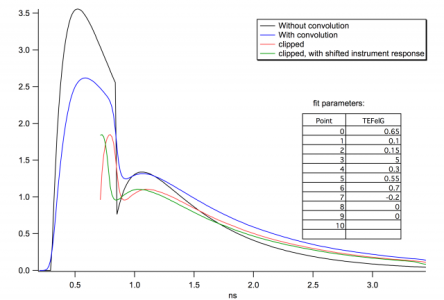
Fit functions using convolution - how to elegantly fit sections of a curve
The problem starts when I want to fit a small section of the curve - the outcome is the red curve in the plot. There is clearly an issue with the convolution on the left side of the curve. I've found I can improve the curve by shifting the instrument response (green curve), but there is still an artefact, and now the right side of the curve is affected as well.
Here is my code:
Function twoExpFelConvTest(pw, yw, xw) : FitFunc
    WAVE pw, yw, xw

    xw = xw - pw[4]
    Variable a = exp(-(pw[5]/pw[1]))
    Variable b = ((exp(-(pw[5]/pw[0])) - exp(-(pw[5]/pw[1])))*pw[0])/(pw[0] - pw[1])
    yw = pw[3]*(xw>=0) * ( (xw<pw[5])*(((exp(-(xw/pw[0])) - exp(-(xw/pw[1])))*pw[0])/(pw[0] - pw[1])) + (xw>=pw[5])*((exp(xw/pw[0])*pw[0]*(b*exp(xw/pw[1] + pw[5]/pw[2])*(pw[7] + pw[6])*(-pw[0] + pw[1]) + a*exp(xw/pw[2] + pw[5]/pw[1])*(-pw[0] + pw[2])) + exp(xw*(1/pw[1] + 1/pw[2]) + pw[5]/pw[0])*(a*pw[0]*(pw[0] - pw[2]) + b*(pw[0] - pw[1])*((1 + pw[7])*pw[0] + (-1 + pw[6])*pw[2])))/exp(xw*(1/pw[0] + 1/pw[1] + 1/pw[2]))/((pw[0] - pw[1])*(pw[0] - pw[2])))  )

    Convolve/A root:convolvedFitting:laserResponseL2, yw
    xw = xw + pw[4]
End
I've also attached a simple Igor experiment that demonstrates the problem.
I was wondering if anyone has encountered this problem before. I believe the standard way to deal with this would be to add data points to either side of the curve with linear regression, and remove them again after convolution. However, this doesn't seem very elegant, since I already know how the curve will continue on either side (I just don't want to include these data points in the fit). Another idea that I had was to fit the entire curve in the Curve fit dialog, but then use two extra fit parameters to define the range I really want. I'm not sure though how Igor will react when my fit function return less data points than it was given.
Does anyone have some useful suggestions?


John Weeks
WaveMetrics, Inc.
support@wavemetrics.com
June 22, 2015 at 03:04 pm - Permalink
June 23, 2015 at 07:04 am - Permalink
June 26, 2015 at 08:10 am - Permalink
It is possible, but a bit trickier to make your fit function independent of the number of points and X spacing. You just (?) need to compute the model at sufficiently high resolution, then extract the needed points using the xw wave to find the right model values. In fact, I think the fit function you wrote after my last post is almost there. You just need to remove the dependence on numpnts(xw) or numpnts(yw), and instead use some measure of needed resolution that you can compute.
In fact, upon re-reading your description of your problem, it's probably best just to use /D=. Note that needs to have as many points as the *entire* Y wave, not the 50-point subset. Igor will fill in just the points corresponding to the subset that you actually fit. Your fitting function won't be called separately to compute those points.
John Weeks
WaveMetrics, Inc.
support@wavemetrics.com
June 26, 2015 at 01:57 pm - Permalink
Also: is there any chance this will work from the Curve Fitting Dialog? It would make my workflow much easier, since I need to adjust my initial fit parameters to my data before I start the actual fitting.
July 1, 2015 at 05:14 pm - Permalink
The confusion, no doubt, is that there are two sets of flags, those at the beginning (right after the FuncFit keyword) and those at the end (after the Ywave). The /D flag you need is the one in the second set of flags.
The /D= option is available in the Curve Fit dialog on the Output Options tab. Choose _New Wave_ as the destination, enter a nice name in the edit box, and the commands to make and use that wave will be generated for you.
Hmmm... I think perhaps the Graph Now button uses the auto-destination wave even if you choose to use an explicit destination via the Destination menu. You can explore it yourself, though. Here are commands that will do it, first if you have a waveform (just one wave with X values set by the wave's X scaling):
You need a suitable coefficient wave, and substitute the real name of that wave for "coefs". I used "ywave" to stand in for your real Y data wave.
Now if you have an XY pair of waves:
Here, I have used "xwave" to stand in for your real X data wave.
In either case, edit "coefs" to try new values, and re-execute the last line to see new results.
John Weeks
WaveMetrics, Inc.
support@wavemetrics.com
July 2, 2015 at 11:30 am - Permalink
Here's a suggestion for the next release: there should be an option in the output options tab of the curve fitting dialog that says "match output to input length" or something similar - it seems logical to me that you'd want an output point for every input point (not just for stuff involving convolutions), instead of getting an arbitrary amount of points - except of course when there's only a handful of input points.
July 7, 2015 at 08:38 am - Permalink
Your complaint about the /D= option leaving data in the unused parts of the wave can be "fixed" by pre-filling the wave with some value. NaN will result in blanks on the graph where you haven't fit the data. My example commands should be expanded like this:
That will work if your data points are equally spaced in X. If they are not, some of the fit curve points will be in the wrong places.
John Weeks
WaveMetrics, Inc.
support@wavemetrics.com
July 8, 2015 at 09:22 am - Permalink