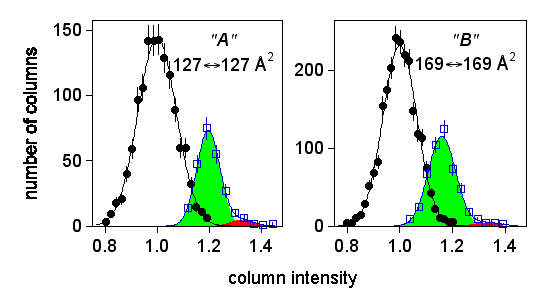

Histograms of atomic column intensities in two filtered images (x and y) from a highly Sb-doped Si sample. The images are different sizes and come from sample regions of different thickness. Filled circles denote columns with no Sb atoms, open squares denote columns containing Sb atoms. The error bars are ±√N, where N is the number of columns in each intensity interval. Intensities are normalized by the mean unoccupied column intensity. The green-shaded area represents columns containing one Sb atom; the red-shaded area represents columns containing two Sb atoms. The areas overlap because the Sb-column intensities depend on Sb-atom depth and because the image processing software uses a local, not global, background to detect objects.
NATURE,VOL 416,25 APRIL2002,p826
Submitted by
Paul Voyles
Assistant Professor
Materials Science and Engineering Department
University of Wisconsin - Madison

Forum

Support

Gallery
Igor Pro 9
Learn More
Igor XOP Toolkit
Learn More
Igor NIDAQ Tools MX
Learn More


