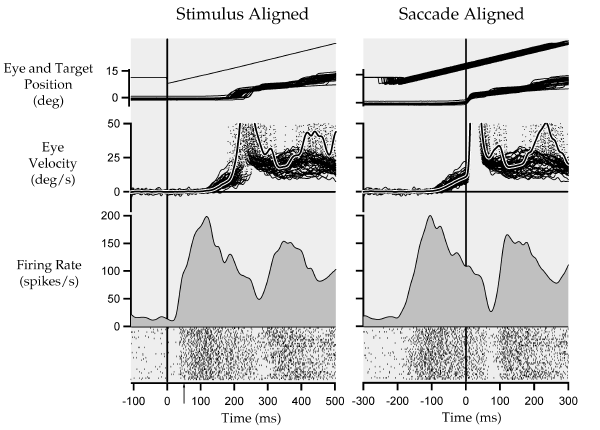

This graph shows raster and spike density data from a paper we published in 2002. The graph shows the response of a brainstem pursuit neuron and corresponding eye movements during horizontal tracking of a smoothly moving visual target spot. The left panel shows the data aligned to onset of the stimulus, while in the right panel, the same data is aligned to the occurrence of a rapid eye movement called a saccade which is used to "catch up" to the target spot and match eye velocity to target velocity. The figure shows several IgorPro features that I think are ideal for displaying systems-level neurophysiological data including the ability to plot multiple axes that share the same time base and the ability to code display types that are not built in as basic IgorPro features, in this case, the raster plot. Although this version of the figure is in a slightly different form, the original citation is:
Das, V.E., Economides, J.R., Ono, S. and Mustari, M.J. (2001) Information processing by parafoveal cells in the primate nucleus of the optic tract. Experimental Brain Research 140(3), 301-10.
Submitted by:
John Economides, PhD
Beckman Vision Center
University of California
San Francisco, California

Forum

Support

Gallery
Igor Pro 9
Learn More
Igor XOP Toolkit
Learn More
Igor NIDAQ Tools MX
Learn More


