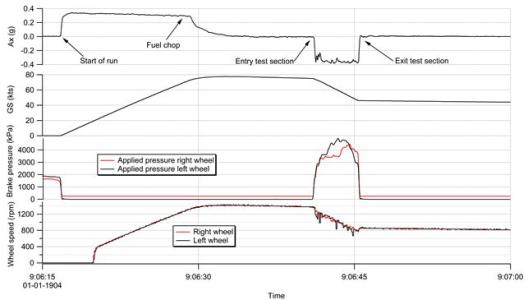
Date shown on axis when plotting a time dependend variable
I have a simple problem which I can't solve! I have a simple stacked plot with several a parameters as function of time. The time wave is given as hour:min:sec. The wave is formatted as time. On the horizontal axis the time scale is shown correctly. However, also shown is the default date of 01-01-1904 in the left corner. I have no idea how to remove this date in the plot. Any suggestions how to do this?


In the 'ticks and grids' tab of the axis properties dialog look for the 'Date/Time Tick Labels' settings.
ModifyGraph dateInfo(bottom)={1,1,0}
August 9, 2023 at 01:58 am - Permalink
In reply to In the 'ticks and grids' tab… by tony
Completely overlooked that option! Many thanks!!
August 9, 2023 at 05:16 am - Permalink