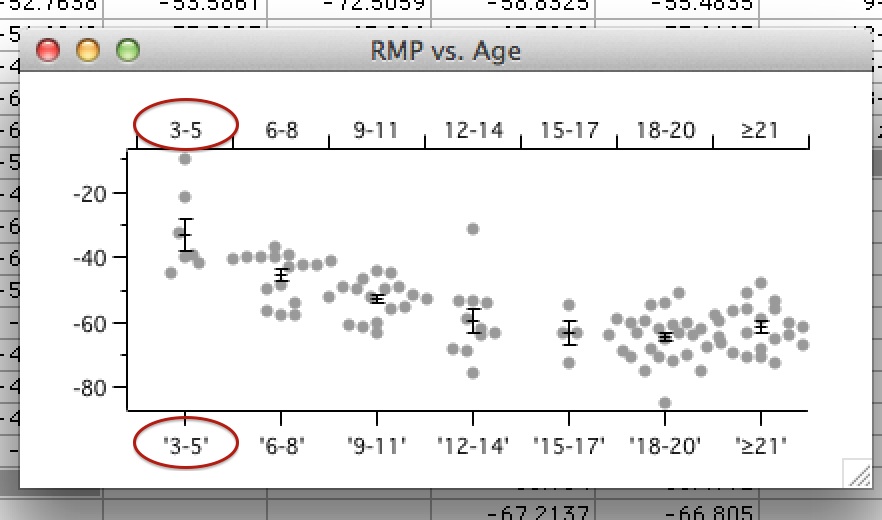
can I exchange the top x axis with the bottom one? OR can I append a scatter dot plot to a category plot?


pangeng
As attached, what i did is making a scatter dot plot and then appending a category plot to it.
but the problem is category names at the x axis. for scatter dot plot, the name is bracketed by ' . So can I ask how to avoid the marker ' ? or can I move the x axis of category plot to the bottom?
Sincerely
Geng