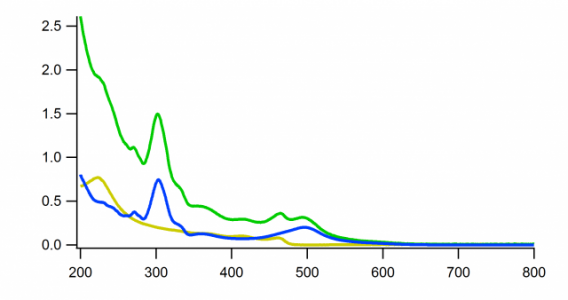
Overlapping Absorption curves

chriswo
I am trying to unravel the proportions of two species of molecules within an absorption spectra. My first approach was to use the multipeakfit you provided, but I am not happy with the results. What I would like to do is the following:
I would like Igor to perform a fairly simple thing, namely fitting the ratio of two waves (A & B) such, that it matches a 3rd one (C) and extracting the absoulte and total number, i.e. C=x*A+y*B and to get x,y and y/x or x/y. I attached an exemplary scan: blue and yellow in the right ratio are supposed to give green.
I couldn't think of a simple way of doing this, nor did I find it in the forum - maybe I didin't use the right keywords.
Apart from that, I am a graduate student, that just started with Igor, so consider me a novice :).
Thanks in advance!


May 7, 2014 at 01:54 am - Permalink
create a user defined fitting function with two independent variable, which will result in something like this
Then use the curve fitting dialogue, select function test, cc as Y data and aa and bb as X data to run it. You need to enter initial guesses for x1, x2. Maybe you have done something like this, but then you need to explain why you were not happy with the results.
May 7, 2014 at 04:55 am - Permalink
This function makes some assumptions. The two standard waves must be waveforms- that is, they are defined by a single wave with the X values encoded by the wave's X scaling. If you don't know what that means, please go to Help->Getting Started and go through at least the first half of the Guided Tour.
There is no provision for dilation and offsetting- it is assumed that the data set is truly represented by simply mixing the two standards.
As written, the standard waves must be named exactly "standardwave1" and "standardwave2". Naturally, you can change the names if you wish.
This is not the most efficient implementation. If your data sets are very large a more complex implementation might be called for.
Copy the code above into your Procedure window. After compiling you will find FitMixingRatio in the list of fit functions in the Curve Fit dialog. To make it available whenever you run Igor, read this help:
DisplayHelpTopic "Fitting to a User-Defined Function"
then scroll down to find the sub-section "Making a User-Defined Function Always Available".
John Weeks
WaveMetrics, Inc.
support@wavemetrics.com
May 7, 2014 at 09:15 am - Permalink
May 8, 2014 at 02:23 am - Permalink
I can't use the "real" x-wave (e.g. the wavelength) for the fit or it does not work. Thus the scaling of the x-values is different and it starts with x=0 instead of x=200.
I worked around that "graphically" by shifting it and plotting the fit wave with the calculated x-data, but I hope that I will learn how to do this automatically.
Was that what you meant, John?
Nevertheless, thank both of you for the quick and precise answer.
May 8, 2014 at 03:23 am - Permalink
It also still assumes that your standard waves have standard names; as before you can change the code to accommodate different names. There are tricky ways to accommodate waves with any name, but it probably isn't worth it.
And 2000 points is not a big data set; perhaps 2000000 would be big.
John Weeks
WaveMetrics, Inc.
support@wavemetrics.com
May 8, 2014 at 09:46 am - Permalink