XMCD-Image Evaluation

LausX
I recorded an XMCD-image (500x500) series of Cobalt, see the attached movie. The magnetic domains appear as gray and white areas. Due to laser pulses the domain pattern is changing.
Now I'm interested to figure out how often domains are changing in specific region, in which area in total changes appear and also to see is there some correlation.
Everything should be done automatically.
As a pre-procession step I tried to use ImageTransform findeges, play with treshold to improve the contrast between dark and bright areas but nothing worked really well.
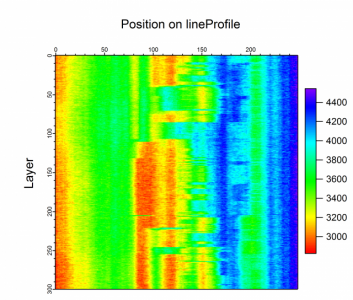
Afterwards I extracted line profiles of each image of the stack and plot all together as a 2d-image (see attached image) the colour scale indicates the "brightness". The line profile is the horizontal line and vertically are the line profiles from different layers.
If you take a look vertically than you cann see how often and how long domains are changing a long the line.
Do you have any idea how to improve the image evaluation?
Thanks


It would be helpful if you were more specific in what you are trying to accomplish.
It is not clear to me which ImageTransform keyword you tried to use. Clearly, finding edges would not be appropriate unless you want to delineate regions.
Some general ideas that may be of interest:
1. You can get the time evolution of any pixel by extracting the "Beam". See ImageTransform with the keyword "getBeam".
2. You can get beam statistics using ImageStats with the flag /BRXY.
3. You can use ImageLineProfile with varying /P flag to sample data along a path similar to the one in your image.
4. You may benefit from displaying your data in Gizmo and looking at either 3D slices, isosurfaces or voxelgrams.
A.G.
WaveMetrics, Inc.
March 19, 2014 at 12:23 pm - Permalink