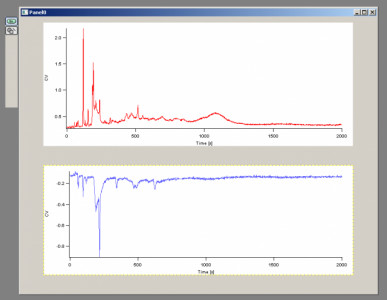
Strategy to make 2 Graphics on one same Panel "Synchronized"

apirls
i have 3 Waves and they are "Time", "CV1" and "CV2", and then i maked a panel with 2 graphics (each graphic in its own subwindow), plane#graphic1 displays CV1 vs Time, and plane#graphic2 displays CV2 vs Time.
Here is my question, how can i make these 2 Graphics synchronized? I mean, the axis for x value could be changed together when i use e.g. "Expand" or "Autoscale Axis".
I thought the best way to solve this is with the window hook function. I tried to detect event "Modified"(case 8 ) in a subwindow and then use "SetAxis" to change the other graphic, but it doesn't work. The Manual shows me this event(Modified) sents to graph and notebook windows only, if it means "modified" will not work for a graphic-subwindow on a panel ?
Then i tired to use the "Menu Detection", e.g. detect the "Expand" in Menu "GraphMarquee", i thought the MenuName is "GraphMarquee" and MenuItem is "Expand", but it returns nothing.
I thought i may have something wrong with my Strategy or something else, so any suggestion or idea will be very appreciated.
Sorry for my English.
Have a Nice Day!


--
J. J. Weimer
Chemistry / Chemical & Materials Engineering, UAHuntsville
January 24, 2014 at 05:58 am - Permalink
That is really a alternative solution and i will try it.
But i stll want to ask, is it possible to do this on a panel with subwindows?
January 24, 2014 at 06:47 am - Permalink
One problem with this is if one context-clicks to autoscale, and the mouseup on the autoscale option is outside the graph, then it does not apply the SetAxis function.
However, I hope this helps a little, even if it is quite clunky!
Rgds,
Kurt
January 24, 2014 at 08:22 am - Permalink
Hm. I tried a quick test of this method. It seems like the best bet for making this work. But I found that the Modified event winName member is the root window (like Graph1) not the subwindow graph that was modified (like Graph1#G0). That's not helpful, and makes it pretty nearly impossible to make that technique work. I'm going to talk to the engineer responsible...
Your English is much better than any foreign language I have ever tried to learn! It was not a problem.
John Weeks
WaveMetrics, Inc.
support@wavemetrics.com
January 24, 2014 at 09:35 am - Permalink
Hi KurtB, thank you so much for this excellnet and awesome idea. It is very helpful, i will try and see if i can avoid the "misunderstand" context.
Good Day!
January 26, 2014 at 11:57 pm - Permalink
Thanks for your help, Johnweeks. If there is any suggestion, could you please post it? It will be very grateful!
Good Day!
January 26, 2014 at 11:57 pm - Permalink
John Weeks
WaveMetrics, Inc.
support@wavemetrics.com
January 27, 2014 at 12:47 pm - Permalink