Hilbert Transform on data


This question is regarding the use of hilbert transform command.
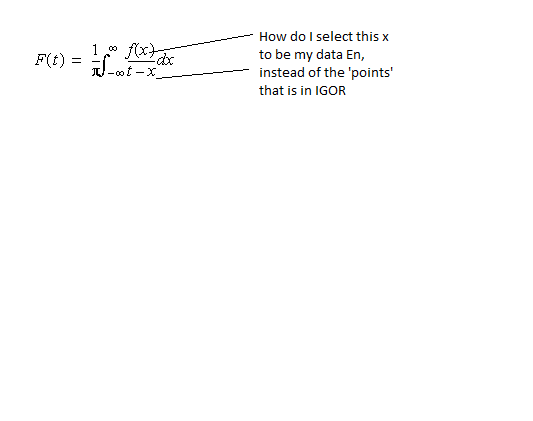
On my hand, I have experimental data for w(omega) and Ln(sqrtR(w)). I hope to do a hilbert transform on Ln(sqrtR(w)) and using the w data. How should I do so? I am asking this question because I realise that the IGOR take hilbert transform on Ln(sqrtR(x)) where x is the point number, instead of what I wanted, and it seems to me that there is no way to specify that i want the hilbert transform to be Ln(sqrtR(w)) instead of Ln(sqrtR(x)).
Kindly refer to the picture attached if my question is still ambiguous.
Thank you all in advance.
REgards,
Eecheng

You need to clarify if w is a variable or w is a function of omega. It would also help to know what is sqrtR().
If you have a function that has an analytic form I encourage you to at least attempt to write down the full integral. If nothing more it might give you a good idea how to tackle the problem numerically. If you do not have an analytic expression and you just have some data that is a function of some parameter w then one would assume that you can either use direct wave scaling or re-sample the data so that it can be represented by a wave with proper wave scaling. Once you have waveform data you can apply the Hilbert Transform.
A.G.
WaveMetrics, Inc.
December 23, 2013 at 12:10 pm - Permalink
anyway, sorry for not making myself clear enough.
The data 'w' is omega, while R is the the reflectivity which is a function of 'w'. Kindly refer to the picture attached for further illustration.
You mentioned about the setting of scale. May I know how this can be done and how does it let me Hilbert transform with respect to 'w', instead of 'x'?
Regards,
Eecheng
December 23, 2013 at 03:04 pm - Permalink
Start by executing the command:
DisplayHelpTopic "HilbertTransform"
At the bottom of the topic you should be able to find an example where w0 is a wave containing exponential decay of a cosine oscillation. The Hilbert transform is calculated to give the analytic signal (w0 +i*w0h) from which you can extract the envelope and phase. Note that the example includes a phase unwrapping step which may or may not be relevant to your application.
As you can see, this example includes wave scaling using the SetScale operation. This is an elementary concept in IGOR so it might be a good idea to understand its use before getting to HilbertTransform. You can find out more about this topic by executing the command:
DisplayHelpTopic "The Waveform Model of Data"
I hope this helps,
A.G.
WaveMetrics, Inc.
December 23, 2013 at 03:22 pm - Permalink
I have read the help topic that you mentioned and try to do the following.
Commands typed:
make/ N=100 xdata
Setscale/I x,0,4*pi,xdata
make /N=100 ydata
ydata=cos(xdata)
HilbertTransform /DEST='ydata 1' ydata
make /N=100 'ydata h'=-1* 'ydata 1'
Kindly refer to the picture attached for the values.
From what I know, the hilbert transform of a cosine function gives a sine function. However, the data 'ydata h' does not give me sine function; when xdata =0, 'ydata h' is not 0.
May I know how I can improve this?
Regards,
Eecheng
December 23, 2013 at 05:37 pm - Permalink
Now type on the command line …
Change the color on hdata to see the difference to ydata.
--
J. J. Weimer
Chemistry / Chemical & Materials Engineering, UAHuntsville
December 24, 2013 at 07:41 am - Permalink
Thank you for the reply. However, the approach that you mentioned does not seem to work.
I guess it has smth to do with the amplitude scaling (from what I read from the help topic "Fourier Transform"). However, I do not know how I can scale the amplitude of the sine-wave.
Please enlighten me.
Regards,
EC
December 25, 2013 at 06:49 pm - Permalink
--
J. J. Weimer
Chemistry / Chemical & Materials Engineering, UAHuntsville
December 26, 2013 at 06:24 am - Permalink
As you can see, you get two sinusoidal waves that represent the sine and cosine (the transform). If you are not sure about this, apply cursors to consecutive peaks with cursor A on ddd and cursor B on hddd and you will see that they are 25 wave points apart. Since 2*pi are covered in 100 points the phase difference is 25*2*pi/100 or pi/2.
A.G.
WaveMetrics, Inc.
December 31, 2013 at 11:04 am - Permalink
Thanks for the reply. I am aware that the command that you typed could give me an “accurate” cosine curve (hilbert transform of a sine curve). However, may I know why is it that I could not get an “accurate” cosine curve if I keyed the following command which I believe essentially does the same thing:
make/N=1000 ddd
Setscale/I x,0,2*pi, ddd
ddd=sin(x)
HilbertTransform/Dest=hddd ddd
setscale/I x,0,2*pi,hddd
By saying an “accurate” cosine curve, I mean the following. When ddd has the value of 0, hddd gets the value of 1. If I keyed in the command above, hddd is 0.988301 when ddd has the value of 0. This is why I am puzzled.
Please allow me to ask another question.
Supposed I have a complex function of ydata + i ydata1. The following is the command I typed:
make /N=100 ydata
•setscale/I x,0,10,ydata
•ydata=1/((x+3)^2)
•Display ydata
•hilbertTransform /DEST=ydata1 ydata
•setscale/I x,0,10,ydata1
•ydata1*=-1
Now I want to make sure that I could get back ydata, if I hilbert transform ydata1.
•hilbertTransform /DEST=ydatacheck ydata1
•setscale/I x,0,10,ydatacheck
However, you can see from the picture 1 attached that ydatacheck is different from ydata.
May I know why is this so? How can I improve this?
January 1, 2014 at 05:56 pm - Permalink