Automated plotting of multiple waves using multiple axes

neutron
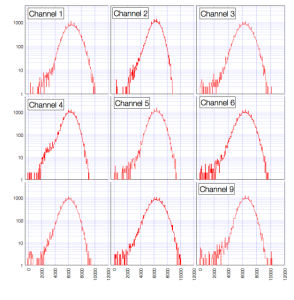
I have a system which generates several channels of data, in multiples of 9. I've been writing small scripts to automate the process of reducing the data and histogramming them and so on. Now I'm a bit stuck in my attempts to make plots of the sets of 9 waves (see attached image), because I can't figure out a slick way of laying them out using a loop. So far I've been doing them manually but that is a terrible option now that my experiment is generating a lot of data.
In my automated version, I have the data in subfolders, and they all have the same name unlike in my example below.
Thanks in advance for any and all responses!
Display as "Histograms of the first 9 channels"
ModifyGraph width=800,height=800

AppendToGraph/L=l1/B=b1 chan_1_hist
ModifyGraph mode=6
ModifyGraph lstyle=0
ModifyGraph grid(l1)=1
ModifyGraph grid(b1)=0
ModifyGraph tick=3
ModifyGraph standoff=0
ModifyGraph log(l1)=1
ModifyGraph mirror(l1)=0
ModifyGraph fSize=14
ModifyGraph noLabel(l1)=0
SetAxis l1 1,5000
SetAxis b1 -500,12000
ModifyGraph freePos(l1)={-500,b1}
ModifyGraph axisEnab(l1)={0.66,1.00}
ModifyGraph freePos(b1)={0,l1}
ModifyGraph axisEnab(b1)={0,0.32}
ModifyGraph mirror(b1)=1
ModifyGraph noLabel(b1)=2


AppendToGraph/L=l2/B=b2 chan_3_hist
ModifyGraph mode=6
ModifyGraph lstyle=0
ModifyGraph grid(l2)=0
ModifyGraph grid(b2)=0
ModifyGraph tick=3
ModifyGraph standoff=0
ModifyGraph log(l2)=1
ModifyGraph mirror(l2)=1
ModifyGraph noLabel(l2)=2
SetAxis l2 1,5000
SetAxis b2 -500,12000
ModifyGraph freePos(l2)={-500,b2}
ModifyGraph axisEnab(l2)={0.66,1}
ModifyGraph freePos(b2)={0,l2}
ModifyGraph axisEnab(b2)={0.33,0.65}
ModifyGraph mirror(b2)=1
ModifyGraph noLabel(b2)=2


It's not pretty. That's your job:)
John Weeks
WaveMetrics, Inc.
support@wavemetrics.com
November 19, 2013 at 10:59 am - Permalink
November 20, 2013 at 12:17 am - Permalink