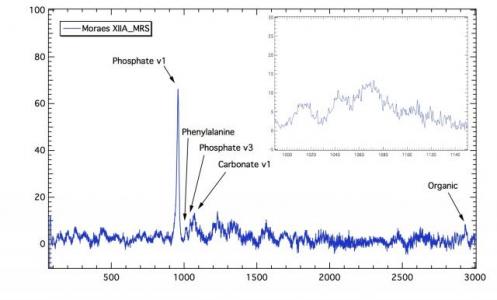
Insert a graphic inside a graphic
I would like to insert a graphic (as pdf picture) inside a graphic, so I can show a zoomed part of it. I've watched again all the tutorials and made a search here but couldn't find anything like this. I was able to add the picture using the annotation tool, but I cannot resize it.
Is it possible?
Perhaps it's much more easy to use any image editor, but I like the quality of pdf graphics from IGOR :)
Attached is a picture of what I'm trying to do.
Many thanks


then
EDIT: just on re-reading your post - you want to insert a picture into a graph. Then the above is maybe not what you want, but you could use it to blow up regions of interest.
June 11, 2013 at 06:43 am - Permalink
I have both graphic and picture once I thought it would be easier to add a picture instead of graphic!
But in anyway thanks for the suggestion.
June 11, 2013 at 07:05 am - Permalink
I recently encountered a similar situation of inserting another graph's picture into a graph. My rationale there was that (a) the picture was created from a graph in another complicated pxp, and (b) the graph was of a large 2D wave. However, I finally concluded that it was much more convenient to import the 2D wave and show it in a subwindow. This allows you to tweak the appearance very easily, rather than go back and forth regenerating a new picture for each minor change.
June 11, 2013 at 10:41 am - Permalink
June 11, 2013 at 11:52 am - Permalink
I'll try and I am almost sure it will be as I wanted!
June 12, 2013 at 08:28 am - Permalink
--Jim Prouty
Software Engineer, WaveMetrics, Inc.
June 12, 2013 at 11:02 am - Permalink