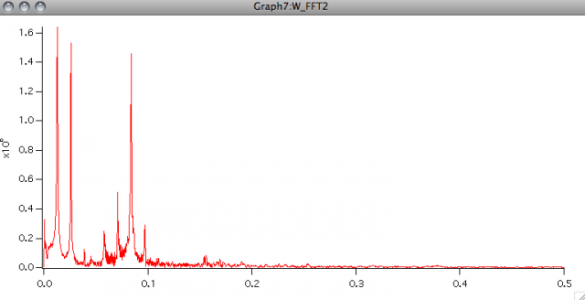
the bottom axis of FFT graph

yewu
I have taken the FFT of one signal , the resulting FFT frequency spectrum is shown in the attached picture. I think the frequency is not right. It should not be quite small.
Whenever I take the FFT, the range of the bottom axis always automatically set as [0 , 0.5]. There are no wave which is corresponding to the bottom axis. Its range is automatically set up by Igor pro itself. I am wondering, how I can change it into the frequency range that seems reasonable ?


You did not tell us how you computed the "spectrum" and it is impossible to determine from your graph precisely what you did.
In general, if your input signal wave has units of time then the output of the FFT operation would have units of Hz. This is not visible on your graph... The actual range of the transformed data, scaling and the units are determined from the length and scaling of the input wave. This is explained in the Analysis section of the documentation. To find out more simply execute:
DisplayHelpTopic "Changes in X Scaling and Units"
I hope this helps,
A.G.
WaveMetrics, Inc.
October 13, 2011 at 09:37 am - Permalink
1) copied an array (1 column, 100 rows) into IgorPro's table0
2) clicked Analysis on the top menu bar, and selected Fourier Transforms
3) with "Forward" radio button selected, "wave0" as the source data, Output type "complex", Output type "Auto", and the Display Output Wave checkbox selected (and New Graph --> Src & Output, stacked axes); I pressed "Do it"
4) I obtain my original graph and a fourier-transformed graph. The fourier-transformed graph has its x-axis ranging from 0.0 to 0.5.
I checked the Igor instructions manual at http://www.wavemetrics.net/doc/igorman/III-09%20Signal%20Processing.pdf, and noticed that all of the example plots that are the result of FFT also have their x-axis ranging between these values.
I'm wondering if it is possible to edit this?
July 25, 2012 at 09:38 am - Permalink
The default wave scaling (time increment between array elements) is 1 (second). If your data isn't spaced that far apart, then you need to heed the previous advice: set the X scaling of your input data to match your sampling frequency. Enter this command to show the relevant help:
Then do the FFT, and the result's maximum frequency won't be 0.5 Hz, it'll be 1/2 your sampling frequency.
--Jim Prouty
Software Engineer, WaveMetrics, Inc.
July 25, 2012 at 10:02 am - Permalink
I had a similar issue in generating the exact frequency axis during Fourier transformation in IGOR, but I finally figured it out.
Follow these steps;
1. you need to first scale the data. (HOW?)
2. Go to Data tab in igor and open "Change wave scaling' window. Select the wave whose Fourier transform you would want to have.
3. This is the crucial step! use the parameters properly. I personally choose start and delta options. (In my case, my start time was 20 fs and delta was 4 fs, so I entered the options as; start = 0.02 and delta = 0.004). you can put anything in units, it doesn't matter. leave other things as such. Click 'Do It'.
4. Go to Analysis and open "Fourier Transform" window and then select the same wave, choose output type, input range of the selected wave (from 0 to end serial number). In case you end serial number is even, then use end - 1. (for example if you have 100 points in your wave. The serial number will range from 0 to 99, enter the options as 0 and 99. In case you have 101 points, that means they will run from 0 to 100, at that time don't put input range from 0 to 100, rather from 0 to 99).
5. One can also do padding using an 2^n number of points. like 128, 256, ...
6. Display output wave as new graph. you will get your x-axis as THz and you can convert that into cm-1 by multiplying it with 33.33.
Done...good luck
November 12, 2014 at 05:17 pm - Permalink