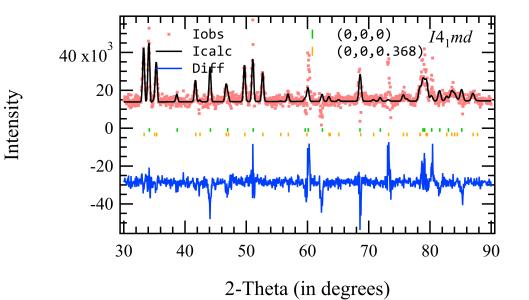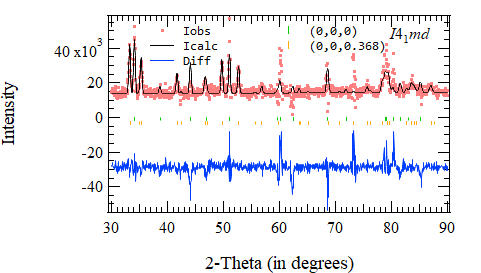
Graphics export changes appearance of graph
I am using Igor Pro 8.04, so perhaps the solution to this is to just update to the most recent version, but it is also possible this bug has not been fixed, so I will still post this question.
I have uploaded two pictures. One is a graphics export using: SavePICT/E=-5/TRAN=1/B=576 . The other is a screenshot of the graph whose graphics were exported. If you look at the word "Diff" in both pictures, you will see that the pictures are different (apart from the differences due to one being a screenshot and one being a transparent graphics export).
I am wondering if there is a way to do a "what you see is what you get" graphics export.
Thanks all


hmm, I can't seem to reproduce the problem. In both Igor 8 and 9 (Windows), the image comes out correctly (same as your top image). Are you using mac or windows for this?
October 24, 2024 at 11:25 am - Permalink
You may also want to report on the screen resolution and application that you are using to capture the snapshot.
I have to wonder whether using an offset of the offending annotation using relative coordinates to the top right plays a role. At export, doesn't the sizing expand the window size by a factor of eight to increase resolution and then shrink it back to the actual size? Could the misplacement be due to round off errors in expanding and then shrinking the graph to the right (right) side??? What happens when you reset the annotation position to be based on relative coordinates to the top left of the graph?
October 24, 2024 at 05:19 pm - Permalink
You have set the anchor of the annotation to the right top of the graph, yet placed the annotation manually on the left side. This invites all kinds of trouble including the one you see now. While I may agree that Igor could behave more consistently here, simply switching the anchor to the left position will fix your problem immediately. I very much recommend setting the annotation anchor to a position close to where you have placed the box (bonus: using the same distance values such as the default X=5 and Y=5 guarantees that everything looks consistent across multiple graphs). I also would recommend fixing the graph margins if you absolute need a consistent look between screen and output and between different graphs.
October 24, 2024 at 09:55 pm - Permalink