Track width

annalisa
Hello everyone,
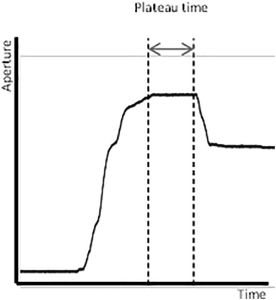
I am trying to track the width of a plateau through time in Igor Pro.
I thought that one could use the differentiation and find the Min and max, signalizing the "start" and "end" point of the plateau.
However, there are many points that have a bigger gradient at some point and is not the plateau border.
Has someone an idea how I could optimize and adapt my idea ?
I thought about setting borders for the WaveStats command to simply search in the first quarter and last quarter, but I did not figure it out.
PS: I used V_min and V_max.


HI,
Some questions and thoughts. How is the plateau defined? Is it flat a constant value or somewhat so? Or another definition, is it time above a certain value?
Things I would myself start looking at is using findlevels with a threshold set to a given amplitude. The resulting waves will be the point where the wave crosses that value and if set to a value other than the absolute max, could result in pairs of crossing, first up and then down. With the difference between two points being the plateau time.
If you are looking at "Flatish" behavior, then I might use a derivative and couple it with a logical test to see if the absolute value at that point is above a threshold. Combined it would give you a 1 for in a plateau and 0 for everything else. I would then use findlevels again with a trigger value of 0.5 to see where it transitions.
Some ideas.
Andy
September 16, 2024 at 08:21 am - Permalink
I presume you are saying that noise in your data causes excessive noise in the derivative, which is not surprising- a numerical derivative amplifies the noise. Sometimes you can smooth the data and take derivatives of the smoothed data. You have to be careful, of course, not to smooth away meaningful features in the data.
We don't have built-in support in the Derivative operation, but it is also possible to use higher-order kernels for computing the derivative. Such higher-order kernels use a wider window to estimate the derivative, which effectively applies some smoothing to the derivative.
Could you post the actual data in the graph so we could play with it?
September 16, 2024 at 09:39 am - Permalink
I do derivatives on data that has noise using a slope method. I use an interface as shown below. Here's the code for the two primary calculation functions.
September 16, 2024 at 06:43 pm - Permalink
Thank you all for your quick responses !
In the attachment I copied my 2D wave into a text file.
I now consider using FindLevels and tried to Split my 2D wave into multiple ones:
However, if I use the function multiple times, all the new waves are simply appended.
Has anyone an idea how I could solve my "problem" (maybe after years of IgorPro this will be easy).
Thank you all :)
PS: the peak in the "plateau" area should be simply seen as part of the plateau. I thought of setting the threshold to 10 in FindLevels and simply save two borders for each wave
September 17, 2024 at 02:35 am - Permalink
How about making a histogram of measurements. Assuming that you take measurements regularly, each plateau should make a peak in the distribution, and the peak centred at the highest measurement value gives you the highest plateau average, and possibly the width will correspond to the measurement error. Armed with that info, you could filter the data to determine the plateau.
September 17, 2024 at 03:11 am - Permalink
I loaded your data- I dragged your file into Igor's command window, and that loads the file as individual waves.
The data in that file doesn't look much like the picture you posted up top. Here is my graph of column 6:
/sites/default/files/2024-09/annalisaIgorExchangeGraph.png
That data looks like it should be pretty easy to handle with Igor's `FindLevel` operation. So I have to ask: where did the picture up top come from? Is the data file you posted representative, or will some data look like your picture?
September 17, 2024 at 11:25 am - Permalink
Here is a bit of code that works well with the data in your file:
The grunt work is done by `FindAnnaLisaPulse()`. It returns a free wave containing the start and end of the pulse in the input wave. To use it, you need to call it from other code.
Use `FindPulseAndGraph()` to make a nice graph showing what was found. It also saves the free wave as a global wave called <name of input wave>_pulse.
September 17, 2024 at 12:10 pm - Permalink
Here is a graph created by my code
September 17, 2024 at 12:12 pm - Permalink
Thanks a lot @johnweeks !!!!!!
I figured it out slightly different, but I will be able to adapt your Code and use it for my next Analysis ! So big thank you for taking the time and creating a great Code Snippet :)
The data in the first picture was from the internet and just for describing purpose. (Thought I pinned the source somewhere, so to be fair- source: https://www.researchgate.net/figure/Representation-of-the-plateau-time-…; )
Thank you all for your answers !
Kind regards from Munich
September 18, 2024 at 12:24 am - Permalink
Glad I could help!
Just to follow up a bit- the data from the internet has quite a different shape compared to your own data, and would require some quite different heuristic to find the correct places for the start and end of the plateau. When you need help with an algorithm like this, that is dependent on the data details, it's always best to share your own data if you can.
September 18, 2024 at 09:38 am - Permalink