Tweak color table label positions

Mike German
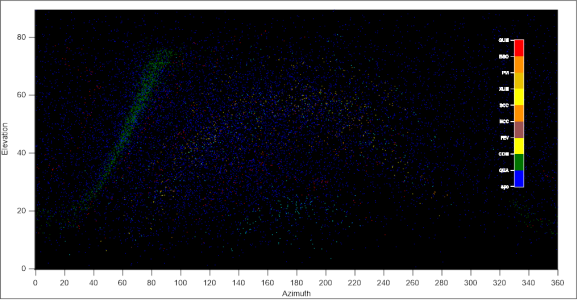
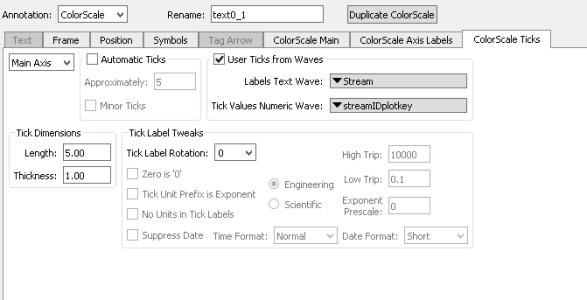
I want to align the headings in the color scale of xyPlot to a position central to the color bar. The data are simply two waves plotted against each other (Azimth and Elevation) and assigned a colour by a integer wave f(z) denoting the meteor stream the point is associated with. The color table wave has 10 points. The settings for the colorAxis are colorAxis.png.
Any thoughts would be much appreciated


In the 'ColorScale Main' tab, just under the 'Color Table Wave' drop down menu, you can set the Min and Max range for the Color Table Wave. Set these to -0.5 and 9.5, respectively, and you should get the labels to be centered like you expect.
September 13, 2024 at 11:32 am - Permalink
Yep, that works- thanks to you again!
September 14, 2024 at 07:09 am - Permalink