Draw on top of colorscale

KZarzana
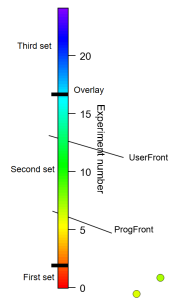
I have a trace that is colored by experiment number, and the tick marks on the color scale are also experiment number. I would like to add a couple lines to the colorscale to indicate several groups of experiments (see attached screenshot). If I use the drawing tools the colored box in the colorscale covers up the lines. If I set the draw layer to Overlay then the lines are on top, but the overlay objects don't show up when I export the image. The Annotations layer option is greyed out. Is there a way to draw on top of the colorscale box? I can probably use a second colorscale, but that seems pretty kludgy. I'm on Igor 8.04.


In the Drawing Layers help topic, the Overlay layer is described as:
The "right" way to get what I think you want is to use user ticks from waves for Axis 2 of the ColorScale annotation object. Here is an example, tested with IP9
March 14, 2023 at 09:02 am - Permalink
The sample code works fine on Igor 8, but it unfortunately doesn't give quite the effect that I wanted, with a line across the colorscale. I tried using a second colorscale with a frame around the color boxes, but that ended up being way more complicated than anticipated. Since it was really only two lines, I ended up adding them in Paint.
Perhaps for Igor 10 there can be another layer in between the Front and the Overlay layers that goes on top of annotations, or a flag when saving pictures to include objects in the Overlay layer.
March 14, 2023 at 10:16 am - Permalink
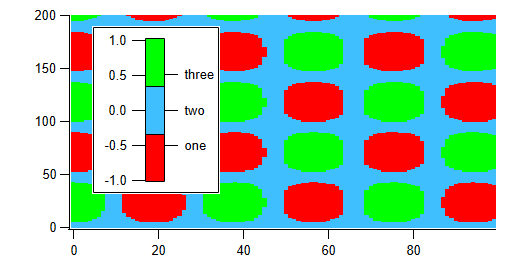
If you use a color wave with just the right number of colors in it, then you can use a color scale with boxes around the colors. I did one quickly with three colors, and didn't spend much time to make it perfect:
With more effort, you can get the range of numbers and the text labels to line up better.
March 14, 2023 at 11:00 am - Permalink
Here's the experiment file that made that picture.
March 14, 2023 at 11:10 am - Permalink