Remove traces from graph with loops

kaatii
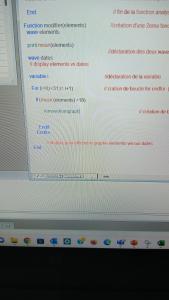
hello I calculated the average concentration of my elements then I made a graph (name graph 0) which represents the concentration according to the dates. now I would like on my graph 0 to delete the elements whose average concentration is <18 so I made a loop as in the figure (I'm sorry for not putting the codes directly I'm new with Igor) but when I executes my function it doesn't execute the condition for me, only it recalculates the average can you help me please


Screen shots are ... rather impossible to read well if at all.
Please learn how to post your code. Use the Insert Code Snippet button. Copy the code from the procedure window in Igor Pro and paste it directly into the Code Snippet window.
December 20, 2022 at 03:08 pm - Permalink
December 20, 2022 at 05:18 pm - Permalink
Reading this and both previous topics it seems that you want to "blank-out" data points on a graph that fall below a certain threshold. All of the commands that you need to accomplish this were already mentioned. If this is not what you want then you need to explain it in more detail.
There are several problems with the code above and I don't know what you want do with "mean()", but maybe try this one:
In your case you would execute from the command line:
modifier(elements, dates, 18)Yy, xx, and threshold are just place-holders for whatever you want to pass to the function. To understand what is otherwise happening, please execute
DisplayHelpTopic "? :"December 21, 2022 at 12:26 am - Permalink