Why when I do redimension the graph will distort?
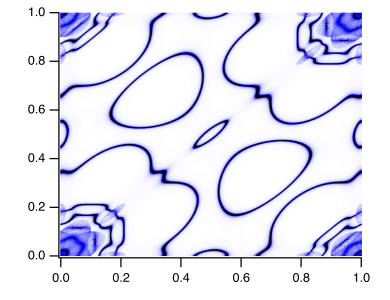
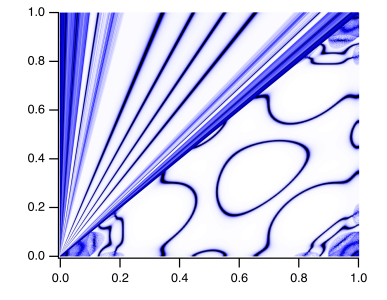
I have many waves, three of which form a group. For example ,wave0,wave1,wave2 form a group where wave0 is x coordinate, wave1 is y coordinate and wave2 is the weight which serves as f(z). I can plot them as shown normally in the Igor file but when I redimension these waves or insert points with value zero behind the original waves, the graph begin to distort (the upper figure is the original graph and the lower figure is the graph after redimension). How to solve the problem?


First, it would generally be nice if you could provide a minimal working example of your problem and explain exactly what you did to get to this point. For example, it was not clear that you meant your function f2() to produce the lower graph you showed, and also the code for f2() was not working with the waves you were providing.
Anyway, after fixing the code I get some similar graph. Here, the graph is not distorted but rather all traces correctly wrap back to zero, as Redimension fills the newly created points with zero by default. You need to fill the new points with something useful to be correctly displayed. But this depends on what you want to do. What is the reason for tripling the number of points here?
April 19, 2022 at 02:43 am - Permalink
In reply to First, it would generally be… by chozo
Thank you very much. First you need to run f1() and then f2() to get the second graph. I want to do 3-fold rotations, i.e. two successive 120 degree rotations of the original graph so I triple the number of points. But the result is weird as shown below.
April 19, 2022 at 03:03 am - Permalink
Ah I see. As written above, the problem is that traces connect to the respective next point which creates these seams. You can circumvent this in various ways. For example, you could change the graph mode to dots, i.e.,
ModifyGraph mode=2Or you introduce one NaN value between the repeated sets. Traces are not connected across NaN.
By the way, I see a few optimizations you could do here. First, 2/3s of your waves are redundant since they simply contain a constant (for color) and a linear rise (x-values). The former could be done by simply applying a color via a script instead of using f(z) and the latter could be achieved by using Igor's wave scaling feature. Then, I wonder if it wouldn't be more efficient to first convert your data into an image before doing the rotation. But I don't know what data fidelity you want for the final result.
April 19, 2022 at 03:50 am - Permalink
In reply to Ah I see. As written above,… by chozo
You solved my problem. Thank you very much!
April 19, 2022 at 04:00 am - Permalink
Great that it worked. You can also adjust the dot size to adjust the "density" of the lines. But as I said, it might be much easier to work with an image instead of these hundreds of waves in a normal graph. The script below converts everything into an image, so that you don't need all these individual waves anymore:
April 19, 2022 at 09:58 am - Permalink
In reply to Great that it worked. You… by chozo
Thank you! I learned something from you.
April 19, 2022 at 04:29 pm - Permalink