Distorted graphics when copy-paste exporting DrawLine

serrano
I just stumbled upon an export issue when I tried to copy-pased a graph into Keynote, where a user-drawn line in the graph seems to be improperly exported.
Demo:
Window DemoGraph() : Graph
    Make/O dataX={0.00198277,0.00254643,0.00576172,0.0161956,0.0330659}
    Make/O dataY={0.00163742,0.00385768,0.00651854,0.0164143,0.0307037}
    Make/O dataXERR={0.000464621,0.000374654,0.000454043,0.000618449,0.00240709}
    Make/O dataYErr={0.000239187,0.000687358,0.000338413,0.0016312,0.00181165}

    Display /W=(246,200,646,369) dataY vs dataX
    ModifyGraph gFont="Helvetica"
    ModifyGraph mode=3
    ModifyGraph marker=19
    SetAxis left 0,0.035
    SetAxis bottom 0,0.035
    ErrorBars dataY XY,wave=(dataXERR,dataXERR),wave=(dataYERR,dataYERR)
    SetDrawLayer UserFront
    SetDrawEnv xcoord= bottom,ycoord= left
    DrawLine 0,0,1,1
EndMacro
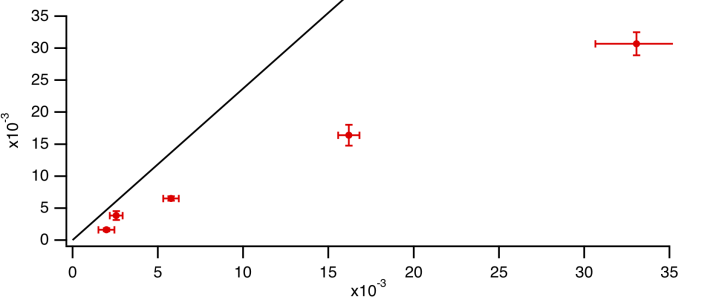
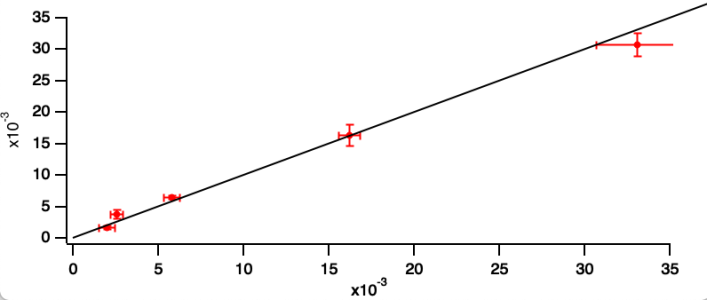
In Igor the line intersects the points. In the exported version it doesn't.
This is on a Mac, IP8.04B01


Hi,
Ran the demo on IP 8.05B01 and copy and pasted in Keynote 10.1 and it shows as intended without the artifact you mention.
Andy
November 20, 2020 at 05:50 am - Permalink
Which export format are you using? That's controlled from the Edit->Export Graphics dialog.
November 20, 2020 at 06:33 am - Permalink
In reply to Which export format are you… by aclight
This was with export format Quartz PDF. It doesn't happen for PNG. Same result in IP8.05B01.
I also see a weird behavior within IGOR when I change the aspect of the window dramatically, e.g. by making it _much_ wider than tall: At some point, the black line seems get stuck in screen coordinates, while the red data points still move with the window coordinates.
November 20, 2020 at 08:48 am - Permalink
That is caused by Igor's ancient integer arithmetic interacting badly with the extreme degree of zoom-in. Your line is drawn over [0, 1] but the axis is [0, 35e-3]. We apologize.
You will find that a PNG at 8x expansion has the same problem- our PDF export expands the graph by 8x first to eliminate annoying integer artifacts in the PDF.
In Igor 9, the code involved was completely re-written to use floating-point calculations, and this sort of problem doesn't happen any more.
The work-around is to reduce the range of the line to something like [0, 0.1]
November 20, 2020 at 11:57 am - Permalink