Surface plot question

Matt Carnie
Hi,
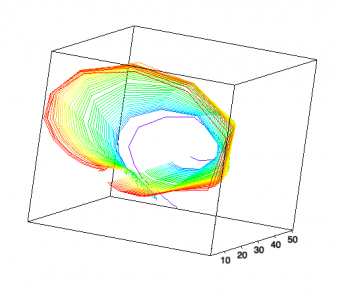
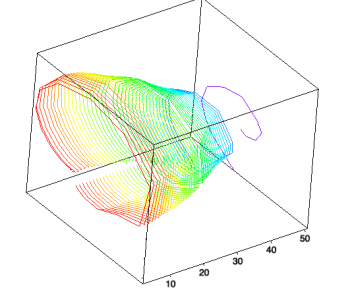
I have some X,Y,Z data which I have concatenated into XYZ tripletWaves. The Z data in this case is a time stamp. For e.g. for data obtained at 1 second, Z=1 for all X and Y values in that triplet, at 30 seconds, Z=30 for all X and Y values, etc etc.
I've plotted the data as paths as you can see from the images. The numbers you can see on the scale are the Z-axis. You can see nicely how the traces change over time but I'd like it to look smoother. I'm trying to figure out a way to blend the paths along Z-axis so that you would get a tunnel effect with the outer portion of the data forming a graded surface.
Is this possible?
Many thanks,
Matt


Have you tried using a surface plot instead of a plotting as paths?
November 15, 2020 at 07:06 am - Permalink