Correlating two sets of xy locations

hegedus
Before I start from scratch on this problem for a colleague, I am looking for a head start.
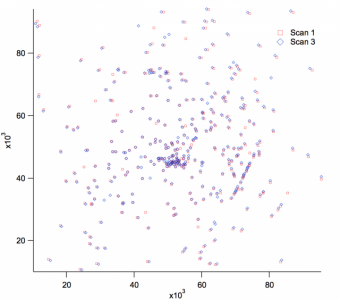
The problem: I have two sets of particle data from a defect inspection tool and the question is what particles were added (or removed) from the pre and post measurements. The issue is that the substrate is hand loaded into the tool so the coordinate systems are off a bit with an X and Y translation as well as a rotation. The particles may also have shifted slightly between measurements. So how do I correlate the frames of references between the data sets and line up particles that were there originally and which are newly added? See attached image for the representative data.
Some thoughts I had was to hand select via a marquee matching pairs and then create an algorithm to calculate the offset and rotation. Any other ideas.
Thanks in Advance


Just a thought -- you might be able to use ImageRegistration to account for small offsets/rotations.
A.G.
WaveMetrics, Inc.
March 16, 2010 at 10:19 am - Permalink
March 16, 2010 at 11:56 am - Permalink
That should work fairly well, if you have them select 3+ pairs, and then choose the parameters for a rotation/translation matrix that gives a least-squares fit between all the pairs they have selected.
You could also have Igor automatically choose paired points between the two scans, i.e., for each point on Scan 1, find the closest neighbor on Scan 3 (e.g., by looking at (x1-x3)^2+(y1-y3)^2 for all points in scan 3 within a small box around (x1, y1)). Then you could do a least-squares fit for all of these pairs using the method above. You could also repeat this to fine-tune -- e.g., if the scans are badly misaligned the first pass might make bad guesses in the dense region, and would mostly end up aligning based on the points in sparse regions. But later passes would start with better guesses about points in the denser region, and would end up choosing a final alignment based on all the points.
March 18, 2010 at 05:59 am - Permalink
The are some important things to keep in mind. My data was vector so when I create an initial graph and then save it as image care must be taken to understand the reference point for the rotation is the center of the image which if I included axis and labels was to simple to translate back to the original coordinate system. So I created graphs without axis by compressing the margin to almost 0 (you cannot use 0) in the modifygraph dialog box.
Then I needed to convert the pixel displacements to the units in the original graph coordinate system.
I will try the alternative technique to hand find matching pairs, I think it might be less prone to error.
Thank you for the input and advice
March 18, 2010 at 09:07 pm - Permalink
March 18, 2010 at 09:14 pm - Permalink
Try the magic number -1 for the margin...
John Weeks
WaveMetrics, Inc.
support@wavemetrics.com
March 23, 2010 at 05:16 pm - Permalink