Coordinate Data from 3D Surface Plot

I've generated a 3D surface plot from a 2D height retrace and am trying to extract the x,y, and z values for this 3D plot (right). I can directly extract the Z data by using the "extract layer" function on the retrace image (left) however I can seem to be unable to access the x and y data.

I know I can write a script to generate the x and y data as the points are evenly spaced and then assign the z values from the height retrace to these values to create a wave with x, y, and z info but would prefer an easy way to extract all 3. Moreover, I'll be overlaying this 3D topographical data with elasticity data, is it possible to extract that data simultaneously with my 3D cartesian data in a way that will maintain the spatial relationship?
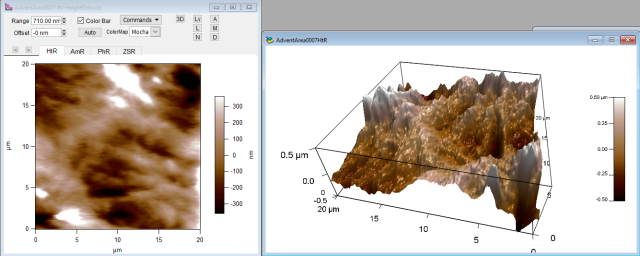

Looks like you are using some OEM package. Since this is not a Gizmo plot you might have better responses to your question on a form for the particular hardware/software.

A.G.
WaveMetrics, Inc.
ggm877 wrote:
I've generated a 3D surface plot from a 2D height retrace and am trying to extract the x,y, and z values for this 3D plot (right).


The images captured by an AFM are always multi-dimensional, no matter how the data is represented. In the image on the left the color coding encodes for the height data (HtR tab selected, R stands for retrace).

All it will take to get the triplet (x,y,z) is to position the cursor wherever you want on the image on the left. How do you do that?

You would call the info pane by pressing ctrl+i or issuing showinfo when the left window is top window. The pane will appear below the window (see attached image: image1.png)

You wold drag and drop the cursor on a feature you would want (see image: image2.png)

Now if you want to read programmatically the positions of the cursor/s, you would have to look for the following set of functions hcsr(); vcsr(); zcsr();. (i.e.)

print hcsr(a)
  1.43836e-07
print vcsr(a)
  1.90802e-07
print zcsr(a)
  9.55797e-09


Good luck!
image1.png (133.27 KB) image2.png (137.96 KB)
_sk wrote:
ggm877 wrote:
I've generated a 3D surface plot from a 2D height retrace and am trying to extract the x,y, and z values for this 3D plot (right).


The images captured by an AFM are always multi-dimensional, no matter how the data is represented. In the image on the left the color coding encodes for the height data (HtR tab selected, R stands for retrace).

All it will take to get the triplet (x,y,z) is to position the cursor wherever you want on the image on the left. How do you do that?

You would call the info pane by pressing ctrl+i or issuing showinfo when the left window is top window. The pane will appear below the window (see attached image: image1.png)

You wold drag and drop the cursor on a feature you would want (see image: image2.png)

Now if you want to read programmatically the positions of the cursor/s, you would have to look for the following set of functions hcsr(); vcsr(); zcsr();. (i.e.)

print hcsr(a)
  1.43836e-07
print vcsr(a)
  1.90802e-07
print zcsr(a)
  9.55797e-09


Good luck!


Thanks for the advice! I had noticed that the cursor feature provided x, y, and z data but was unsure if there was a way to manipulate this within an igor procedure to sequentially go through each of the points and lines and have not had much luck finding a way to do so. Might you know if this is possible or should I base a procedure around a loop using AxisValFromPixel to gather axis data?

ggm877 wrote:
Thanks for the advice! I had noticed that the cursor feature provided x, y, and z data but was unsure if there was a way to manipulate this within an igor procedure to sequentially go through each of the points and lines and have not had much luck finding a way to do so. Might you know if this is possible or should I base a procedure around a loop using AxisValFromPixel to gather axis data?


This is too convoluted. The waves for the images (essentially, the images) are stored in the following path: root:images:_name_. Take a look.

best,
_sk
_sk wrote:
ggm877 wrote:
Thanks for the advice! I had noticed that the cursor feature provided x, y, and z data but was unsure if there was a way to manipulate this within an igor procedure to sequentially go through each of the points and lines and have not had much luck finding a way to do so. Might you know if this is possible or should I base a procedure around a loop using AxisValFromPixel to gather axis data?


This is too convoluted. The waves for the images (essentially, the images) are stored in the following path: root:images:_name_. Take a look.

best,
_sk


Much thanks! I believe I've found a way to go about this.
It appears from your first screen capture that you are using some third-party package built on top of Igor. Now you want to go outside that package and use Igor directly. I recommend that you start with the Getting Started help, especially the Guided Tour. Select Help->Getting Started.

John Weeks
WaveMetrics, Inc.
support@wavemetrics.com