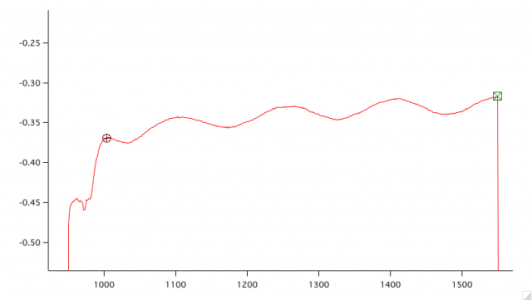
Best way to remove low frequency oscillation in data caused by furnace controller?

reepingk
I would like to remove this oscillation.
I did a manual "high pass" filter using a fourier transform and simply deleting all rows with frequency less than 0.01 Hz (it looks like the frequency of the oscillation is around 6E-3 Hz), then did a reverse fourier transform, but that seems a bit cumbersome. (Sure, I could write a program to do it.)
Side question: When doing a "filter" using fourier transforms, is it better to delete the unwanted frequencies or set them to zero?
I was looking into the filter options of Igor, but I couldn't get them to work correctly. I don't know if it's possible to apply them to a section of a wave instead of an entire wave.
I would like to apply a filter to an area of my wave between two cursors, as seen in the picture below.
EDIT: Performing a simple low pass filter is a bad idea. I don't want to lose any information other than the frequency of oscillation (including the overall slope of the wave), so setting the frequencies around the frequency of oscillation to zero seems to do the trick. Of course the ends are messy, but I may be able to play around with that.


The correct approach would depend on what you want to get out of this data. Could you describe that?
My immediate reaction is that your furnace needs a better temperature controller. My second reaction would be that, depending on what you need to get out of this data, perhaps you could develop a model of the temperature dependence that would allow you to correct for the temperature variation. Do you have a measurement of the temperature?
John Weeks
WaveMetrics, Inc.
support@wavemetrics.com
April 21, 2015 at 09:03 am - Permalink
I agree. We DO need a new furnace controller. I'm doing the best with what I have currently.
Really, all I need out of this information is the slope and overall shape (Does the slope change over the 10 minutes?). Sure, I can do a simple linear fit to get the overall slope. I guess I could represent the data differently, or just trust people will forgive me for the low frequency oscillation.
April 21, 2015 at 09:18 am - Permalink
Have you tried to change the PID settings of the controller (if possible)?
Not sure what your figure actually shows (no axis labels), but it looks a bit like a "swinging-in" problem.
April 21, 2015 at 09:43 am - Permalink
The first data point ([0]) contains a constant offset to your data, so you might want to keep it.
HJ
April 21, 2015 at 10:37 am - Permalink
Yeah, I noticed that when I went to delete points the second time around. The process works OK if I simply delete the 3 points around the frequency of the oscillation.
EDIT: Not delete, I mean set to 0.
April 21, 2015 at 12:50 pm - Permalink