Generating a uniform random distribution of points in a circle
////	@param	num	number of points to be generated
Function UniformCircle(num)
	Variable num

	Make/O/N=(num) xw,yw
	Variable tt,uu,rr

	Variable i

	for(i = 0; i < num; i += 1)
		tt = 2 * pi * (0.5 + enoise(0.5))
		uu = (0.5 + enoise(0.5)) + (0.5 + enoise(0.5))
		if(uu > 1)
			rr = 2 - uu
		else
			rr = uu
		endif
		xw[i] = rr * cos(tt)
		yw[i] = rr * sin(tt)
	endfor
	DoWindow/K resultPlot
	Display/N=resultPlot yw vs xw
	ModifyGraph/W=resultPlot mode=3,marker=8
	ModifyGraph/W=resultPlot width={Plan,1,bottom,left}
End

Forum

Support

Gallery
Igor Pro 10
Learn More
Igor XOP Toolkit
Learn More
Igor NIDAQ Tools MX
Learn More
May 31, 2016 at 03:34 am - Permalink
Run the this code with e.g., 1e6 samples and execute the following commands:
Now compare the avg, sdev, rms, adev and skew between the two...
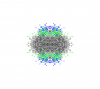
The OP did not state explicitly what is meant by "uniform". My own guess would be: density that is independent of location inside the circle. One can verify angular uniformity using StatsCircularMoments with the /KUPR, but clearly if the radial distribution was also strictly uniform then the density of points per unit area would be higher closer to the origin. A joint histogram for xw and yw can help display the results:
May 31, 2016 at 08:27 am - Permalink