Statistics from Experimental Data

Introduction
This package demonstrates statistical results after doing experimental measurements of a value. The objective is to explain the concepts of precision and accuracy in an easy-to-see manner.

Contents
The package is a self-contained Igor Pro experiment in a ZIP archive. A screen cast that shows the demo in action is available at this Google link
Statistics from Experimental Data
Use
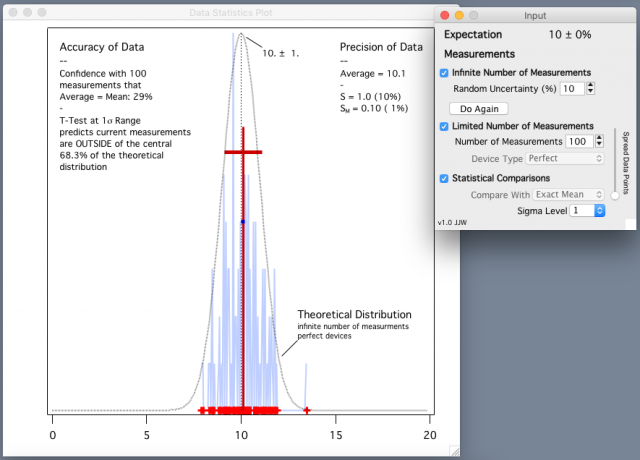
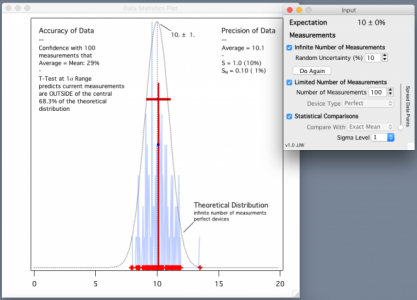
Consider the image of the experiment shown above.
The basis is an expected value (the "truth") of 10 with no deviation.
Use the Infinite Measurements checkbox to show the theoretical distribution of an infinite number of data points. They represent what we would measure when we have a random (NIST Type A) uncertainty of a certain percentage.
Use the Finite Measurements checkbox to show what we would get for the same uncertainty as we make only a finite number of measurements (from 2 to 100 in steps of 2). This will show an annotation on the graph to report the statistics on Precision: the average, standard uncertainty, and standard uncertainty of the mean of the measurements.
Use the Statistical Comparison checkbox to run a t-Test. It will compare the measured data with the perfect mean of 10. This will show an annotation on the graph to report the statistics on Accuracy: the confidence we have that Average = Mean (the p-value from the t-test) and the expectation that our measurements are within certain ranges of standard deviation from the mean.
Project Details
| Project Demo: | View Demo |
Current Project Release
Statistics from Experimental Data IGOR.6.30.x-1.0
| Release File: | Data Statistics Example v1.zip (8.62 KB) |
| Version: | IGOR.6.30.x-1.0 |
| Version Date: | |
| Version Major: | 1 |
| Version Patch Level: | 0 |
| OS Compatibility: | Windows Mac-Intel |
| Release Notes: |
This is the first release version. This has no documentation. The screen cast video is posted at a different location. |

Forum

Support

Gallery
Igor Pro 9
Learn More
Igor XOP Toolkit
Learn More
Igor NIDAQ Tools MX
Learn More
