Encircle


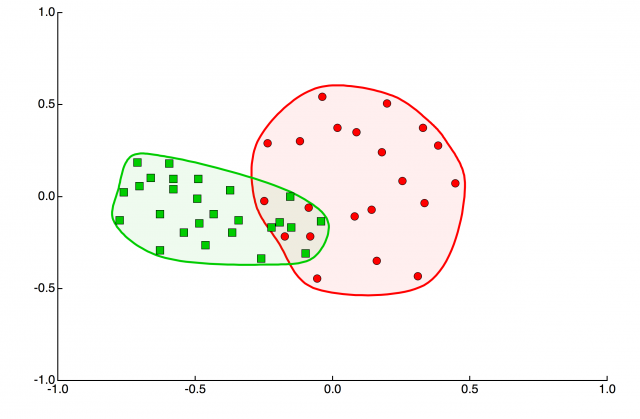
Encircle a cloud of data on a plot and shade the bounded region.
How to use:
- Right click on a data point to invoke the trace menu and select "Encircle points" to draw a polygon that surrounds all of the data in the wave.
- If you change the aspect ratio of the plot area you can repeat this procedure to update the shape of the polygon that surrounds the data.
- Selecting "Remove Encircled Region" deletes the shaded region.
- To encircle a subset of data, use the marquee to select the data, then choose 'encircle points' from the marquee menu. Only one group of data per wave can be encircled.
Polygons are drawn in the user back layer using axis coordinates and can be edited with the drawing tools.
How it works:
The curve that loops around the data is defined by a Catmull Rom spline calculated using the convex hull as nodes. The curve points are stored in the Packages:Encircle folder as a pair of waves with names of the form W_YPoly0_xCR and W_YPoly0_yCR. The polygon drawing object is drawn in the User Back layer and has a group name formed from the data wave name with ‘loop’ appended. The points that make up the polygon have axis coordinates. The polygon does not update when the graph is modified. This means that if you change the aspect ratio of the graph, the polygon should still encircle the data but may become a little elongated, i.e. the data will be inset by different amounts in horizontal and vertical directions. If automatic updating is a feature you need let me know and I’ll think about how to implement it.
Project Details
Current Project Release
Encircle IGOR.7.00.x-1.09
| Release File: | Encircle.ipf.zip (6.82 KB) |
| Version: | IGOR.7.00.x-1.09 |
| Version Date: | |
| Version Major: | 1 |
| Version Patch Level: | 09 |
| OS Compatibility: | Windows Mac-Intel |
| Release Notes: |
Adds drawing to select subsets of data to be encircled |

Forum

Support

Gallery
Igor Pro 9
Learn More
Igor XOP Toolkit
Learn More
Igor NIDAQ Tools MX
Learn More
