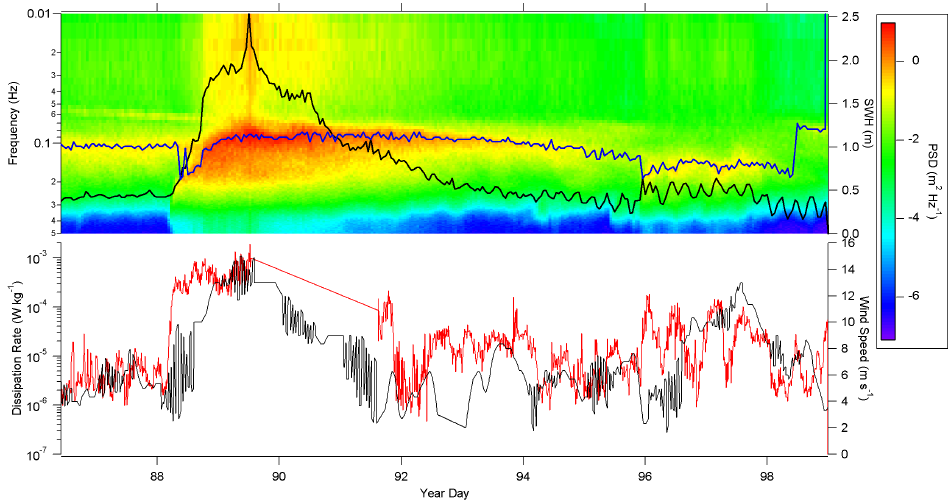

Plot of wave spectral density (PSD), dominant wave frequency (blue), significant wave height (upper black curve), turbulent dissipation rate (red), and wind speed (lower black curve). Data were taken during the Duck DMS Experiment at the Army Corps of Engineers Field Research Facility in Duck, North Carolina in March to April 2004. During the storm event on Days 88-91, the wind speed increases, the dissipation rates increase, and the initially moderately narrow-frequency wave field expands with strong high frequency wave activity as the storm develops. Here, the wind and pre-existing swell were aligned. The sea state eventually reaches a broad spectrum with a large significant wave height. As the storm subsides, the wave field gradually diminishes to a level that is slightly different (lower energy/higher frequency) from pre-storm while the dissipation decreases abruptly at Day 92. A second wind event occurs around Day 96, with comparable wind speeds though not as sustained. re, the dissipation levels do not reach those from the earlier storm and neither do the waves. The wind and pre-existing swell were not aligned. The waves increase slightly in total energy with a small shift to lower peak frequency.
Submitted by Christopher J. Zappa of Columbia University.

Forum

Support

Gallery
Igor Pro 9
Learn More
Igor XOP Toolkit
Learn More
Igor NIDAQ Tools MX
Learn More


