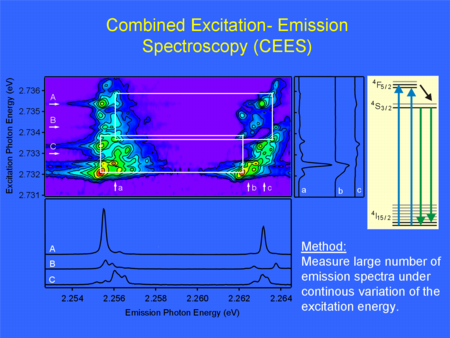

Visualization of different erbium defects with combined excitation-emission spectroscopy. In this spectroscopic method we take advantage of a CCD-detector attached to a monochromator and record a large number of emission spectra for a dense sequence of excitation energies. The resulting 2D data is best visualized in a contour plot. This way emission of different defects can be distinguished and show up as a "peak" in the contour plot. As an excitation source a tunable blue dye laser was used. The excitation-emission scheme is shown on the right side.
Lithium niobate is an attractive host material for applications in optical telecommunication.
Submitted by Christian Sandmann

Forum

Support

Gallery
Igor Pro 9
Learn More
Igor XOP Toolkit
Learn More
Igor NIDAQ Tools MX
Learn More


