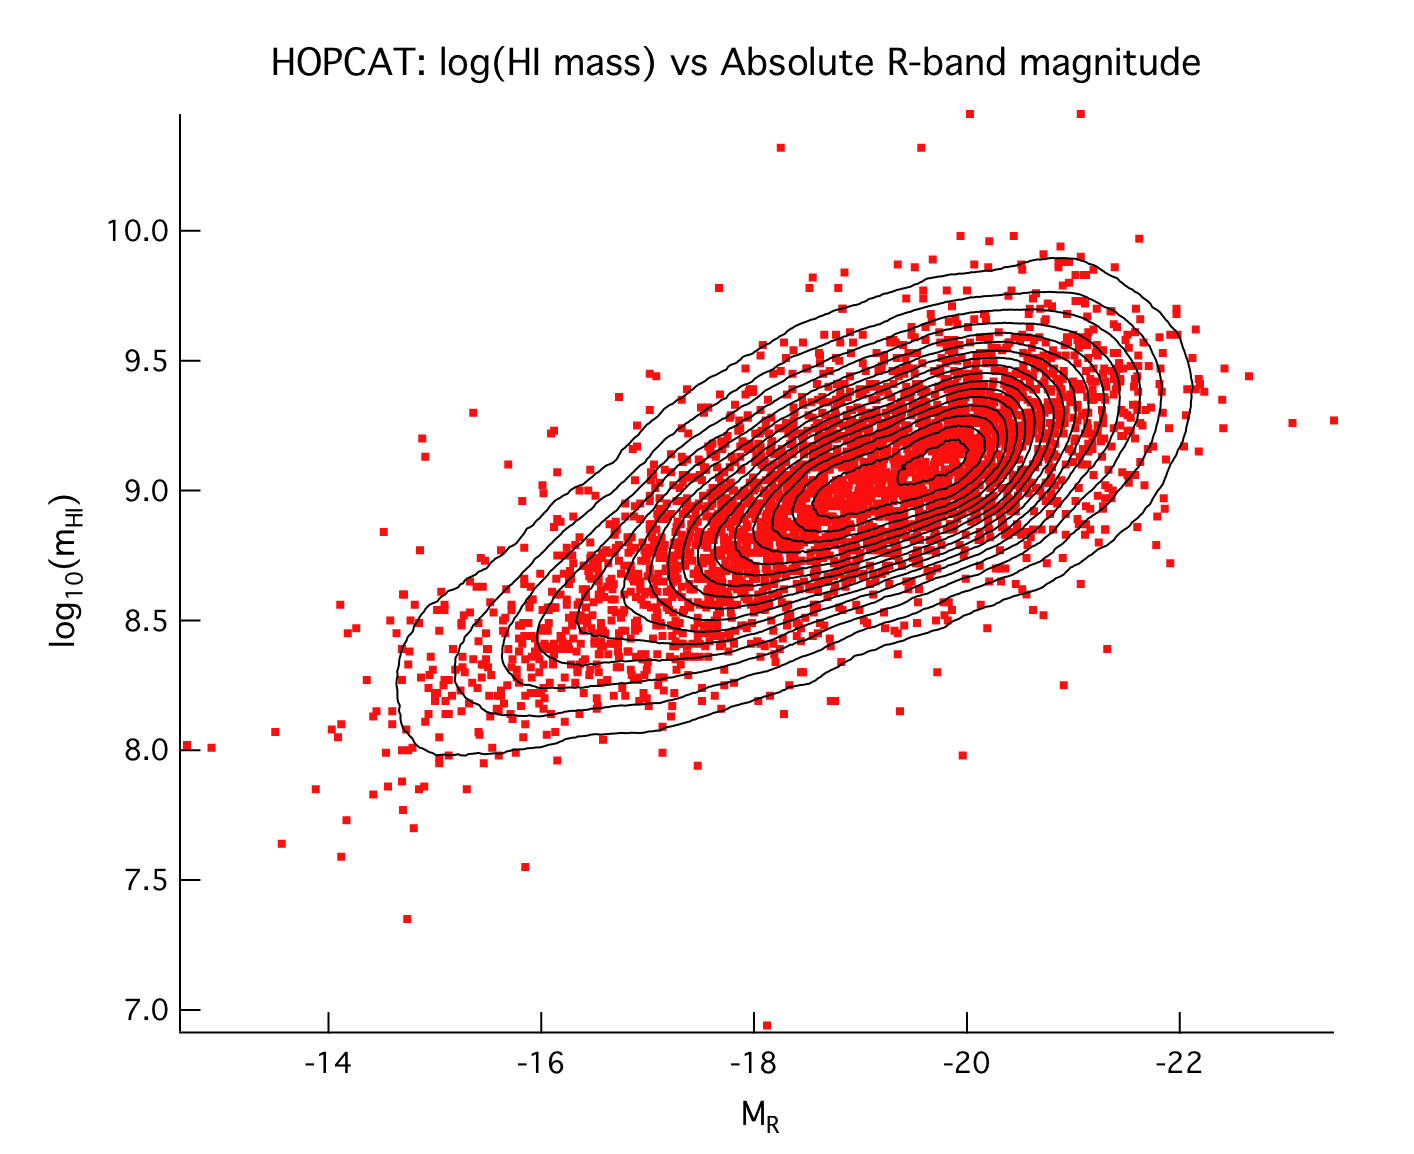

A contour plot of galaxy neutral hydrogen mass vs R-magnitude data overplotted on the data points. The data points are randomly located, not a regular matrix. The contours were calculated by binning them in a 500x500 array, using a 2D Joint Histogram routine.
Submitted by David Nicholls, RSAA, Australian National University.

Forum

Support

Gallery
Igor Pro 9
Learn More
Igor XOP Toolkit
Learn More
Igor NIDAQ Tools MX
Learn More


