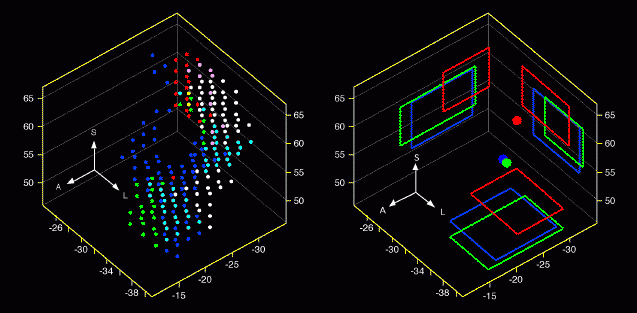

Representation of movement related activation in the primary motor cortex of humans obtained with functional MRI. The left panel illustrates the distribution of activation for the group of participants. Each dot represents the location of a voxel with statistically significant movement related activation. The geographical center and the standard deviations (rectangles on the surface walls and floor) of the activation for each finger is illustrated in the right. A = anterior; L = lateral; S = superior. Graphics created with Igor 3.16 using the SurfacePlotter module.
Submitted by Jerome Sanes

Forum

Support

Gallery
Igor Pro 9
Learn More
Igor XOP Toolkit
Learn More
Igor NIDAQ Tools MX
Learn More


