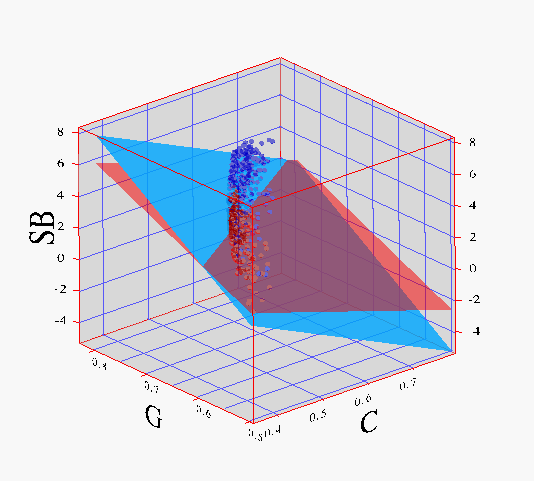

Distribution of central concentration, Gini coefficient, and mean surface brightness for 600 simulated galaxies. Note how all simulated galaxies lie on a well-defined two-dimensional surface (a slightly warped plane) embedded within a three-dimensional parameter space. Red and blue points correspond to different model assumptions about the relative distribution of the central bulge luminosity of each family of galaxies relative to the luminosity of underlying galaxy disks. Red and blue planes correspond to the best-fitting surfaces returned from a principal components analysis of the data.
Roberto Abraham (University of Toronto),
Astrophysical Journal (in press)

Forum

Support

Gallery
Igor Pro 9
Learn More
Igor XOP Toolkit
Learn More
Igor NIDAQ Tools MX
Learn More


