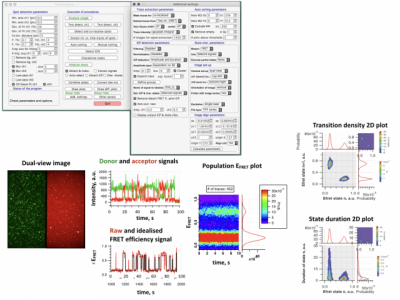
TEA_MT - Intensity versus time trace of fluorescent spots extraction and analysis software

Marijonas
The software was written so that all of the daily single-molecule (and other fluorescent spots) data analysis tasks are accessible at one place:
1. fluorescent spot detection,
2. co-localization of the fluorescent spots from 2 channels,
3. intensity versus time traces extraction for selected type of fluorescent spots,
4. filtering of traces
5. normalization of traces to an excitation field
6. intensity change point detection in the traces,
7. characterization of detected states,
8. manual selection of extracted traces,
9. 2D histogram plotting of the analysis results.
10. It can handle most of the single-molecule image formats, but it works fastest with the tiff image series.
11. The software has internal memory for entered parameters, the size of windows and their positions.
12. Each part of the program gives output as tables of igor binary format. There is an additional function in the main panel to convert them into delimited text format.
13. Software development was under MacOS, therefore, it may happen that Windows users find some small problems.
I am making updates of software constantly, therefore, feedback is highly appreciated: marijonas@ar.fi.lt or marijonas.tutkus@gmail.com
If you use the code in a publication, please inform me.
for reference please cite our recent paper: M. Tutkus, et al. DNA-Endonuclease Complex Dynamics by Simultaneous FRET and Fluorophore Intensity in Evanescent Field. Biophysical Journal, 2017, Volume 112, Issue 5, Pages 850–858.
The package contains several .ipf files:
1. GUI_TA_MT.ipf - user interface,
2. CandM_TA_MT.ipf - fluorescent spot detection/colocalisation and intensity versus time traces extraction,
3. ICPdetection_TA_MT.ipf - intensity change point detection in the extracted traces,
4. mapProc_TA_MT.ipf - 2D histogram plots drawing (transition density, population emission plots),
5. visTrMol_TA_MT.ipf - manual sorting of traces,
6. TEclusionAuto_TA_MT_proc.ipf - auto sorting of traces,
7.StateChar_TA_MT.ipf - characterization of the detected states in the traces.
and a .pdf file with detailed instructions on how to use the program.
View All Releases
1. fluorescent spot detection,
2. co-localization of the fluorescent spots from 2 channels,
3. intensity versus time traces extraction for selected type of fluorescent spots,
4. filtering of traces
5. normalization of traces to an excitation field
6. intensity change point detection in the traces,
7. characterization of detected states,
8. manual selection of extracted traces,
9. 2D histogram plotting of the analysis results.
10. It can handle most of the single-molecule image formats, but it works fastest with the tiff image series.
11. The software has internal memory for entered parameters, the size of windows and their positions.
12. Each part of the program gives output as tables of igor binary format. There is an additional function in the main panel to convert them into delimited text format.
13. Software development was under MacOS, therefore, it may happen that Windows users find some small problems.
I am making updates of software constantly, therefore, feedback is highly appreciated: marijonas@ar.fi.lt or marijonas.tutkus@gmail.com
If you use the code in a publication, please inform me.
for reference please cite our recent paper: M. Tutkus, et al. DNA-Endonuclease Complex Dynamics by Simultaneous FRET and Fluorophore Intensity in Evanescent Field. Biophysical Journal, 2017, Volume 112, Issue 5, Pages 850–858.
The package contains several .ipf files:
1. GUI_TA_MT.ipf - user interface,
2. CandM_TA_MT.ipf - fluorescent spot detection/colocalisation and intensity versus time traces extraction,
3. ICPdetection_TA_MT.ipf - intensity change point detection in the extracted traces,
4. mapProc_TA_MT.ipf - 2D histogram plots drawing (transition density, population emission plots),
5. visTrMol_TA_MT.ipf - manual sorting of traces,
6. TEclusionAuto_TA_MT_proc.ipf - auto sorting of traces,
7.StateChar_TA_MT.ipf - characterization of the detected states in the traces.
and a .pdf file with detailed instructions on how to use the program.
Project Details
| Project Homepage: | View Homepage |
Current Project Release
TEA_MT - Intensity versus time trace of fluorescent spots extraction and analysis software IGOR.6.30.x-1
| Release File: | TEA_MT.zip (9.92 MB) |
| Version: | IGOR.6.30.x-1 |
| Version Date: | |
| Version Major: | 1 |
| OS Compatibility: | Mac-Intel Windows |
| Release Notes: | The attached zip file contains all necessary info. |

Forum

Support

Gallery
Igor Pro 9
Learn More
Igor XOP Toolkit
Learn More
Igor NIDAQ Tools MX
Learn More
