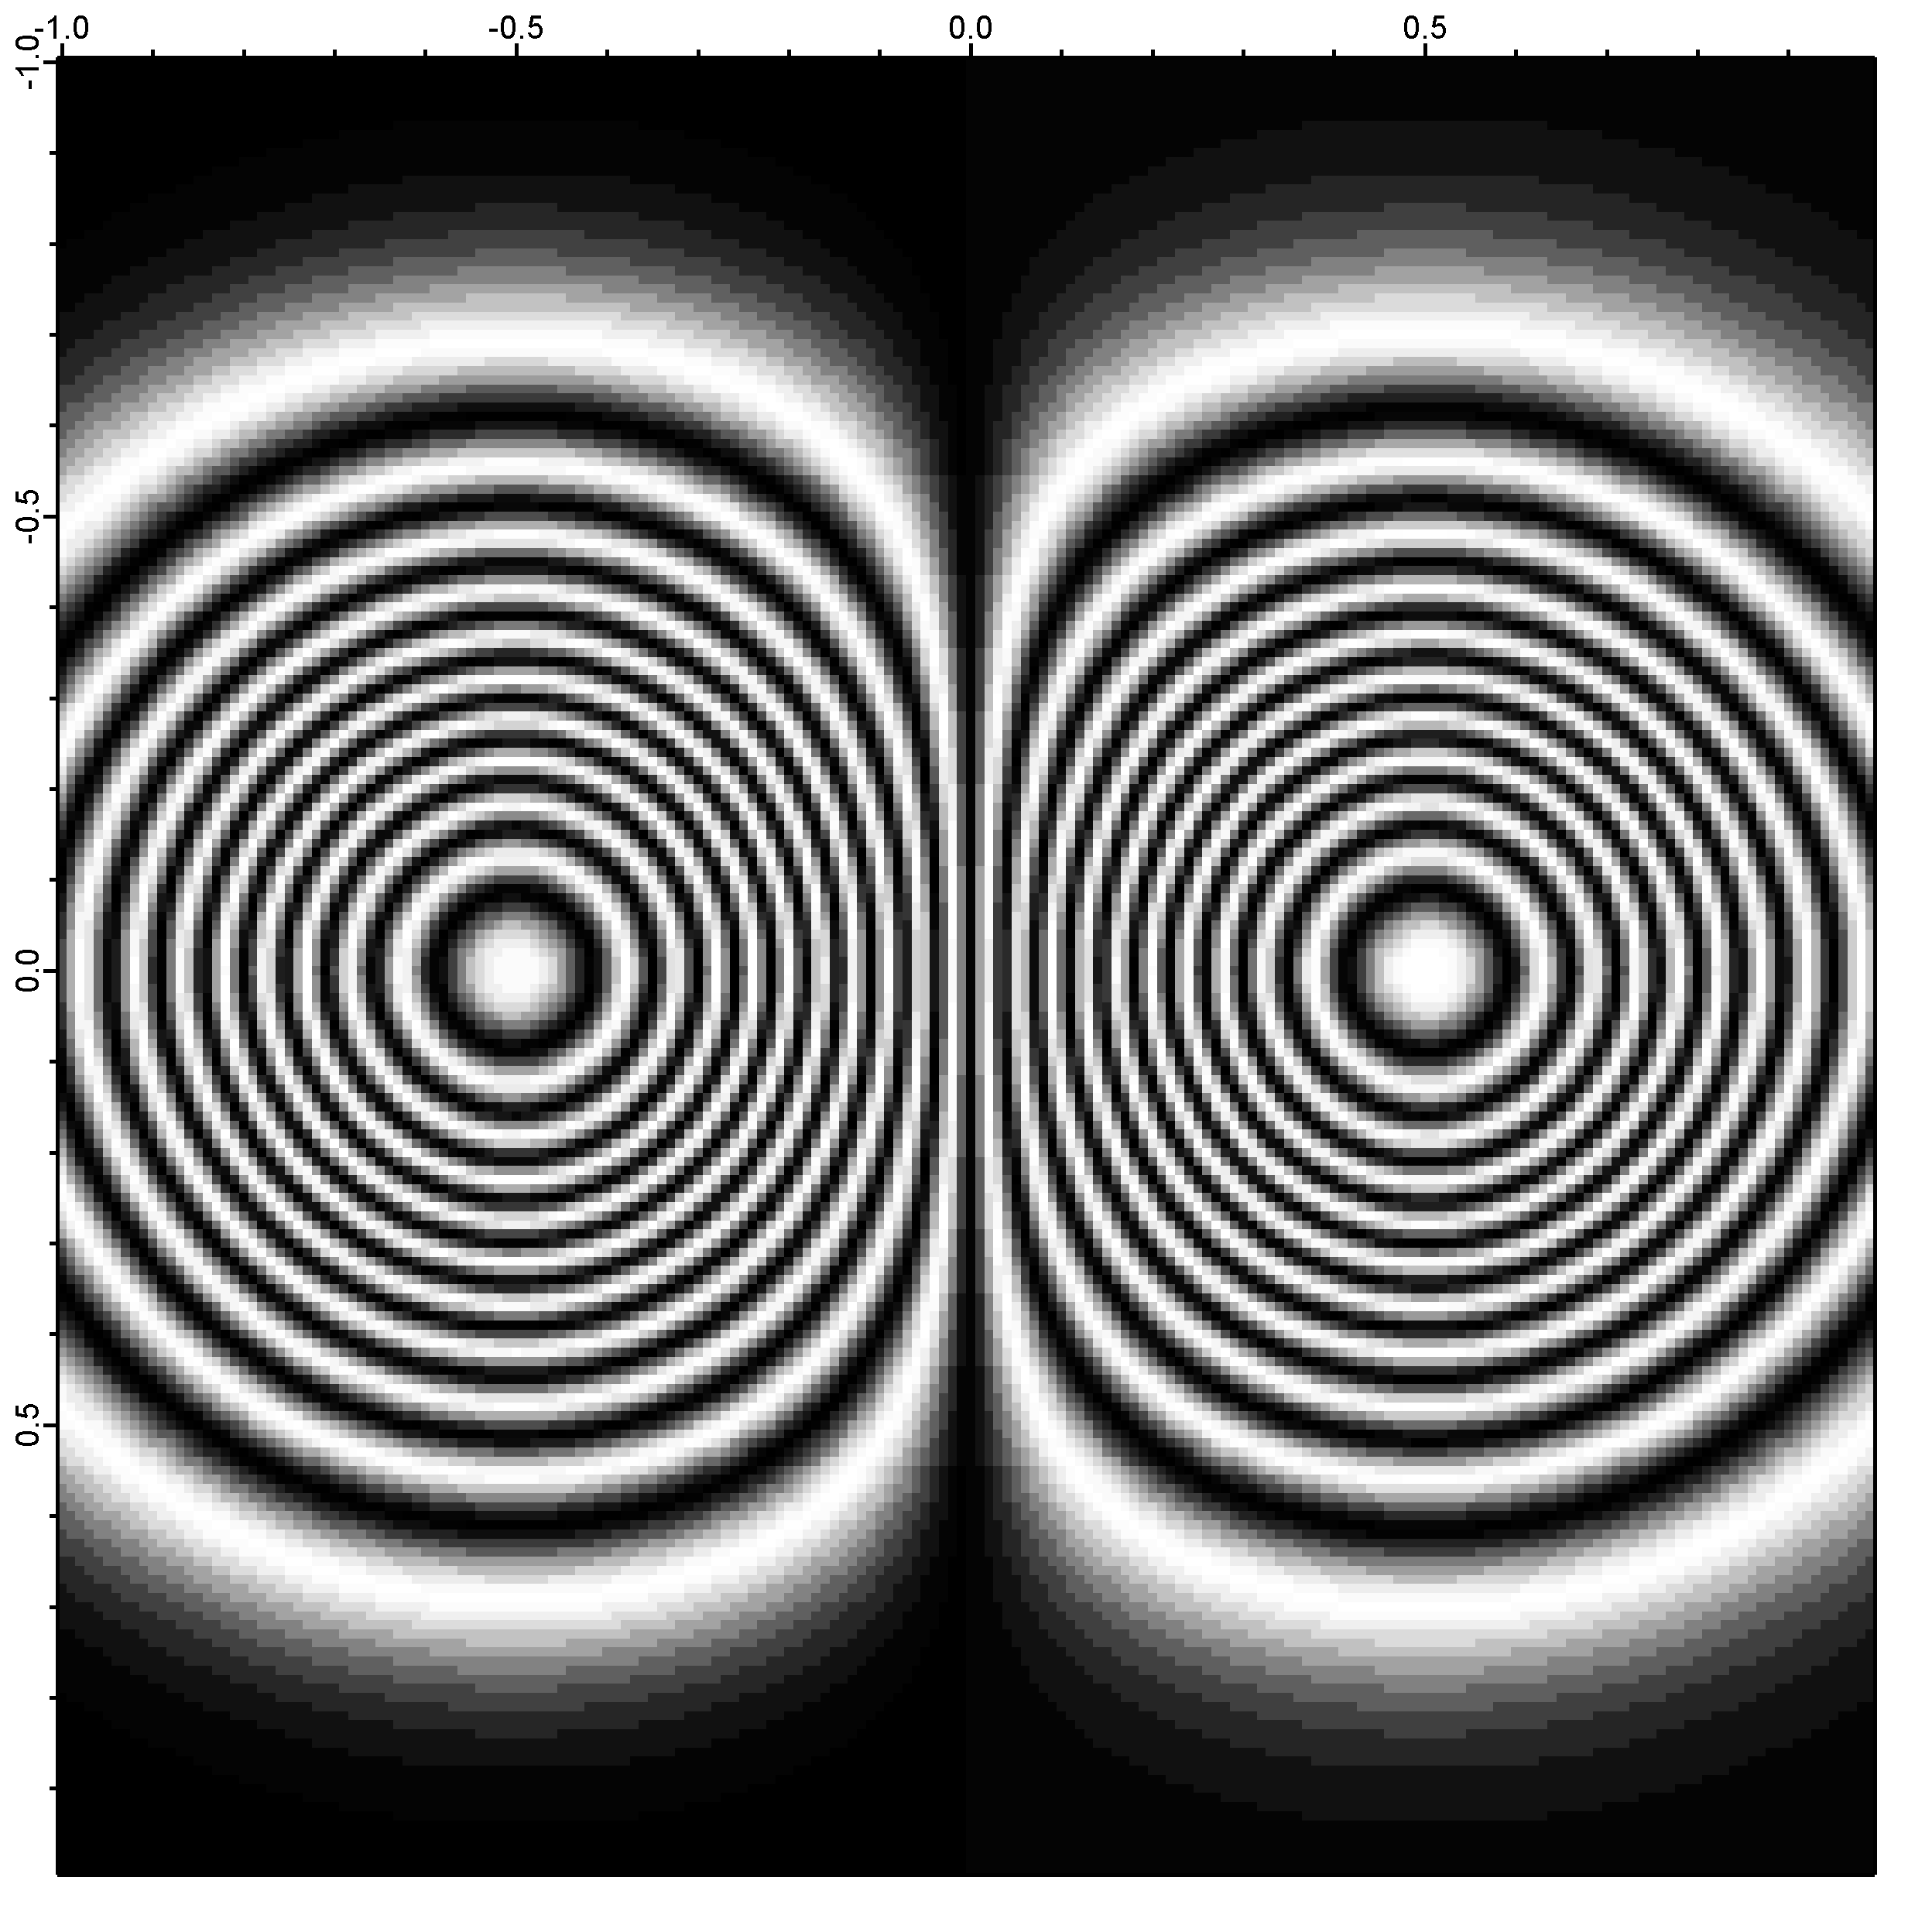
Display images in interferogram (phase variation) mode

#pragma rtGlobals=1 // Use modern global access method.
// best to try this in a new Igor experiment
function MakeAndShowTestImage(a)
variable a // wave peak amplitude in this example, in wavelengths
make/O/N=(200,200) w2D
setscale x, -1, 1,"" w2D
setscale y, -1, 1,"" w2D
// insert (replace) your definition of w2D here:
// height of w2D is measured in wavelengths
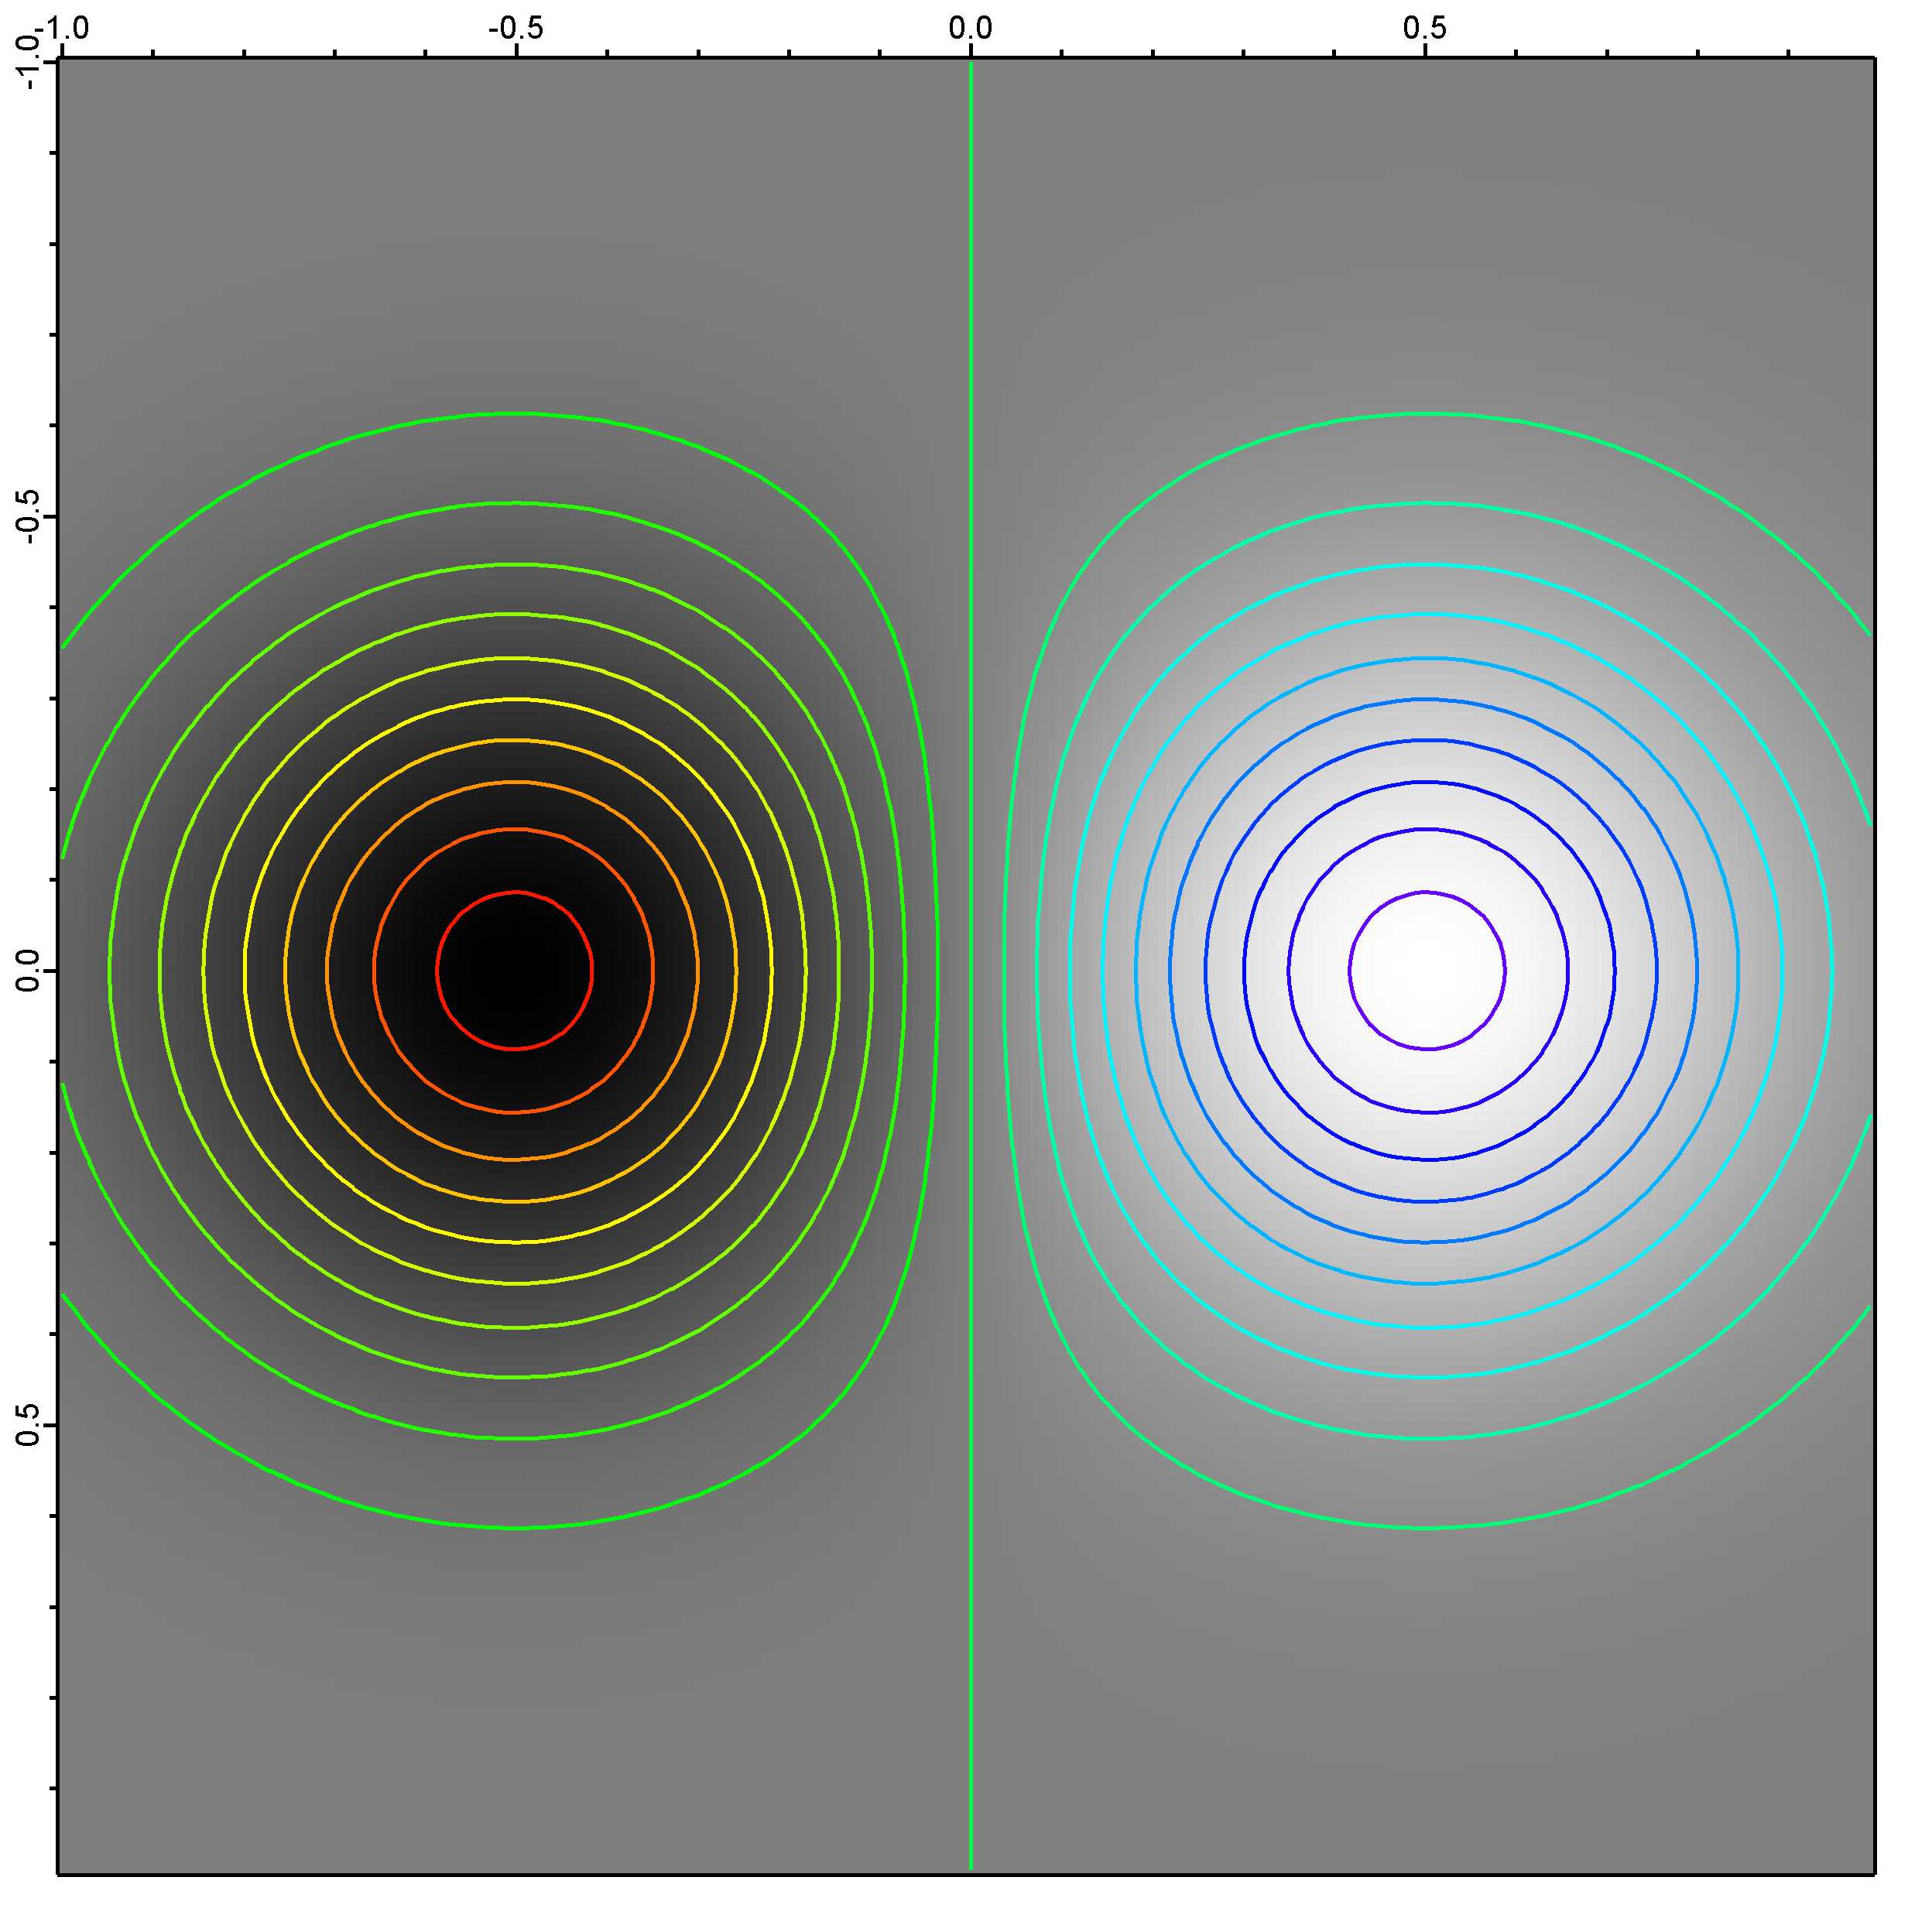
w2D = a*(exp(-(((x-0.5)/0.4)^2 + (y/0.4)^2)) - exp(-(((x+0.5)/0.4)^2 + (y/0.4)^2)))
DoWindow Graph0
if(!V_flag) // if Graph0 doesn't exist, create it with new image
newimage w2D
ModifyGraph height={Plan,1,left,top}
endif
MakeNonLinearColorFunc(w2D) // make the lookup wave
ModifyImage/W=Graph0 w2D ctab= {*,*,Grays256,0}, lookup = wNL
end
//-------------------------------------------------------------------------------------------------------
function MakeNonLinearColorFunc(inwave)
// make a nonlinear image LOOKUP wave to simulate interference fringes
wave inwave // the 2D image wave to be shown as an interferogram
make/O/N=500 wNL
variable xmin = waveMin(inwave), xmax = waveMax(inwave)
setscale/I x, xmin, xmax,"" wNL
wNL = (cos(2*pi*(xmax-x)))^2 // set brightest color at maximum of image
end


Forum

Support

Gallery
Igor Pro 10
Learn More
Igor XOP Toolkit
Learn More
Igor NIDAQ Tools MX
Learn More